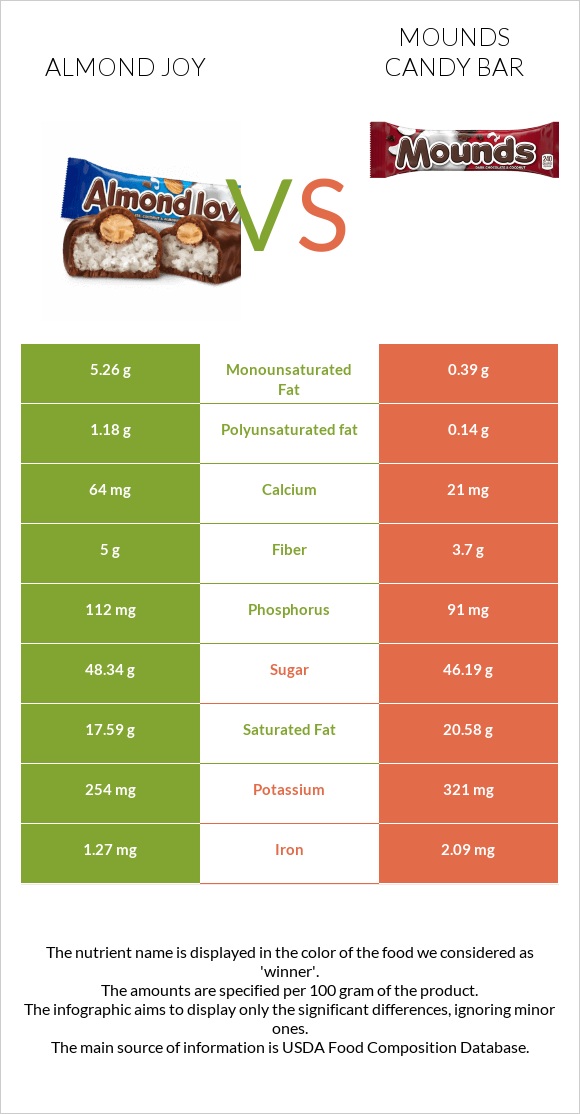
Almond joy vs. Mounds candy bar — Health Impact and Nutrition Comparison


Summary
Almond Joy and Mounds are candies with very high fat and sugar content. A 100g of Mounds contains 20.6g of saturated fats, trace amounts of unsaturated fats, 58.59g of total carbs, and 3.7g of dietary fiber. In contrast, Almond Joy contains 17.6g of saturated fats, 6.44g of unsaturated fats, 59.51g of total carbs, and 5g of dietary fiber.
Long-term increased consumption of these candies may lead to acne development, tooth decay, and metabolic syndrome.
Introduction
Almond Joy and Mounds are candy bars made by the Hershey company; they are very similar in packaging and nutritional values.
Both candies consist of sweetened and shredded coconut; however, Mounds is covered with dark chocolate, whereas Almond Joy is covered with milk chocolate and is topped with whole almonds.
Nutrition
The nutritional values in this article are presented for 100g Almond Joy and Mounds provided by the USDA database.
Macronutrients and Calories
The candies are very nutrient-dense, with over 90% of macronutrient contents.
Almond Joy is slightly higher in fats and dietary fiber, whereas Mounds is slightly higher in net carbs and proteins.
One bar snack of Almond Joy and Mounds weighs 19g, whereas one package of Almond Joy weighs 49g or 1.76oz, and Mounds - 53g or 1.9oz.
Calories
A hundred grams of Almond Joy and Mounds provide 479 and 486 calories. Consequently, an Almond Joy and Mounds package provides 235 and 361 calories, respectively.
Protein
Mounds is slightly richer in proteins; 100g of Mounds contains 4.6g of proteins, whereas Almond Joy contains 4.13g of proteins.
Fats
A 100g of Almond Joy and Mounds contain ~27g of fats. Mounds is 3g higher in saturated fatty acids, whereas Almond Joy is 5.9g higher in unsaturated fatty acids.
The predominant fats in both candies are saturated fatty acids: 17.6g in Almond Joy and 20.6g in Mounds.
Almond Joy contains 6.44g of unsaturated fatty acids and 4g of cholesterol, whereas Mounds contains 0.53g of unsaturated fatty acids and 2g of cholesterol.
Carbohydrates
Almond Joy and Mounds are almost equally high in carbs; however, Almond Joy is slightly lower in net carbs and 1.3g richer in fiber compared to Mounds.
A 100g of Almond Joy contains 59.51g of carbs: 54.51g of net carbs, and 5g of dietary fiber.
A 100g of Mounds contains 58.59g of carbs: 54.89g of net carbs and 3.7g of dietary fiber.
Vitamins & Minerals
The USDA database doesn’t provide information about most vitamins and magnesium, zinc, and copper of Almond Joy; therefore, this section is incomplete.
According to the available information, Mounds contains some levels of B complex vitamins and an insignificant amount of vitamins K, E, and C; Almond Joy contains trace amounts of vitamins A and C.
Mounds is 1.6 times richer in iron, it is also richer in potassium, and lower in sodium, whereas Almond Joy is richer in calcium and phosphorus. Mounds contain magnesium, zinc, and copper.
Mineral Comparison
Contains
more
CalciumCalcium
+204.8%
Contains
more
PhosphorusPhosphorus
+23.1%
Contains
more
PotassiumPotassium
+26.4%
Contains
more
IronIron
+64.6%
Glycemic & Insulin Indices
The glycemic index and insulin index values of Almond Joy and Mounds are not calculated.
Health Impact
Almond Joy and Mounds are unhealthy candies due to their high saturated fat and sugar content. However, moderation is key in preventing metabolic syndrome, tooth decay, and acne.
The presence of coconuts, dietary fiber, and minerals in candies and whole almonds in Almond Joy do not surpass the adverse effects of high sugars and saturated fats on human health.
Both Source of Energy and Cause of Tiredness
Consumption of sweet candies increases blood glucose levels. It leads to increased insulin production, a hormone that allows glucose to enter the cells and provide energy or stores it as glycogen or fat (1).
According to studies, candies or high-carb foods increase energy and reduce tiredness in the short term, later leading to increased tiredness and reduced energy (2, 3).
Metabolic Syndrome
Increased long-term consumption of Almond Joy and Mounds may increase the risk of fat accumulation and metabolic syndrome. Metabolic syndrome is characterized by obesity, high triglycerides, high blood pressure, and insulin resistance, which are risk factors for fatty liver, heart disease, stroke, and type 2 diabetes (4, 5, 6).
According to epidemiological evidence and studies, saturated fatty acids are linked to worsened insulin resistance, a key factor in type 2 diabetes (7).
Dental Caries
Dental caries or tooth decay is a common health problem in people with increased candy or sweets consumption. The bacterial digestion of sugar, the presence of acidogenic bacteria, and the ability of fluoride and saliva to counteract bacteria and acids in the mouth are the mechanisms leading to dental caries (8, 9).
Acne
As mentioned several times, both Almond Joy and Mounds are high in sugar and saturated fats.
Diets high in sugar and saturated fats are associated with an increased risk of acne development and its severity. Overconsumption of sweet candies may lead to serum insulin and IGF-1 elevation, leading to increased androgen production and subsequent acne development (10, 11, 12).
In our “Compare foods” section, you can learn about the nutritional differences between various candies. You can also find a comparative article about maple and brown sugar on our “Maple sugar vs. Brown sugar” page.
Sources.
- https://pubmed.ncbi.nlm.nih.gov/7598079/
- https://pubmed.ncbi.nlm.nih.gov/3820066/
- https://www.ncbi.nlm.nih.gov/pmc/articles/PMC4551584/
- https://e-jla.org/pdf/10.12997/jla.2022.11.1.20
- https://academic.oup.com/toxsci/article/162/1/36/4585010
- https://www.ncbi.nlm.nih.gov/pmc/articles/PMC4822166/
- https://pubmed.ncbi.nlm.nih.gov/15297079/
- https://www.ncbi.nlm.nih.gov/pmc/articles/PMC4802044/
- https://pubmed.ncbi.nlm.nih.gov/31940627/
- https://pubmed.ncbi.nlm.nih.gov/21034984/
- https://pubmed.ncbi.nlm.nih.gov/32520303/
- https://www.ncbi.nlm.nih.gov/pmc/articles/PMC7847434/

Infographic
Vitamin Comparison
| Contains more Vitamin CVitamin C | +75% |
All nutrients comparison - raw data values
| Nutrient | |
|
DV% diff. |
| Copper | 0.4mg | 44% | |
| Manganese | 0.948mg | 41% | |
| Saturated fat | 17.59g | 20.58g | 14% |
| Magnesium | 55mg | 13% | |
| Selenium | 6.6µg | 12% | |
| Monounsaturated fat | 5.26g | 0.39g | 12% |
| Iron | 1.27mg | 2.09mg | 10% |
| Zinc | 1.1mg | 10% | |
| Vitamin B6 | 0.09mg | 7% | |
| Polyunsaturated fat | 1.18g | 0.14g | 7% |
| Fiber | 5g | 3.7g | 5% |
| Vitamin B5 | 0.245mg | 5% | |
| Calcium | 64mg | 21mg | 4% |
| Vitamin B1 | 0.049mg | 4% | |
| Vitamin B2 | 0.058mg | 4% | |
| Caffeine | 17mg | 4% | |
| Phosphorus | 112mg | 91mg | 3% |
| Potassium | 254mg | 321mg | 2% |
| Vitamin B3 | 0.277mg | 2% | |
| Folate | 6µg | 2% | |
| Choline | 11.8mg | 2% | |
| Protein | 4.13g | 4.6g | 1% |
| Fats | 26.93g | 26.6g | 1% |
| Cholesterol | 4mg | 2mg | 1% |
| Vitamin E | 0.19mg | 1% | |
| Vitamin K | 1.6µg | 1% | |
| Calories | 479kcal | 486kcal | 0% |
| Weight per 100 calories | 21g | 21g | N/A |
| Unsaturated / Saturated Fat ratio | 0.37 | 0.03 | N/A |
| Vitamin C | 0.7mg | 0.4mg | 0% |
| Net carbs | 54.51g | 54.89g | N/A |
| Carbs | 59.51g | 58.59g | 0% |
| Sugar | 48.34g | 46.19g | N/A |
| Sodium | 142mg | 145mg | 0% |
Macronutrient Comparison
| Contains more ProteinProtein | +11.4% |
| Contains more WaterWater | +10.4% |
Fat Type Comparison
| Contains less Sat. FatSaturated fat | -14.5% |
| Contains more Mono. FatMonounsaturated fat | +1248.7% |
| Contains more Poly. FatPolyunsaturated fat | +742.9% |
People also compare


References
All the values for which the sources are not specified explicitly are taken from FDA’s Food Central. The exact link to the food presented on this page can be found below.
- Almond joy - https://fdc.nal.usda.gov/fdc-app.html#/food-details/167562/nutrients
- Mounds candy bar - https://fdc.nal.usda.gov/fdc-app.html#/food-details/168759/nutrients
All the Daily Values are presented for males aged 31-50, for 2000-calorie diets.