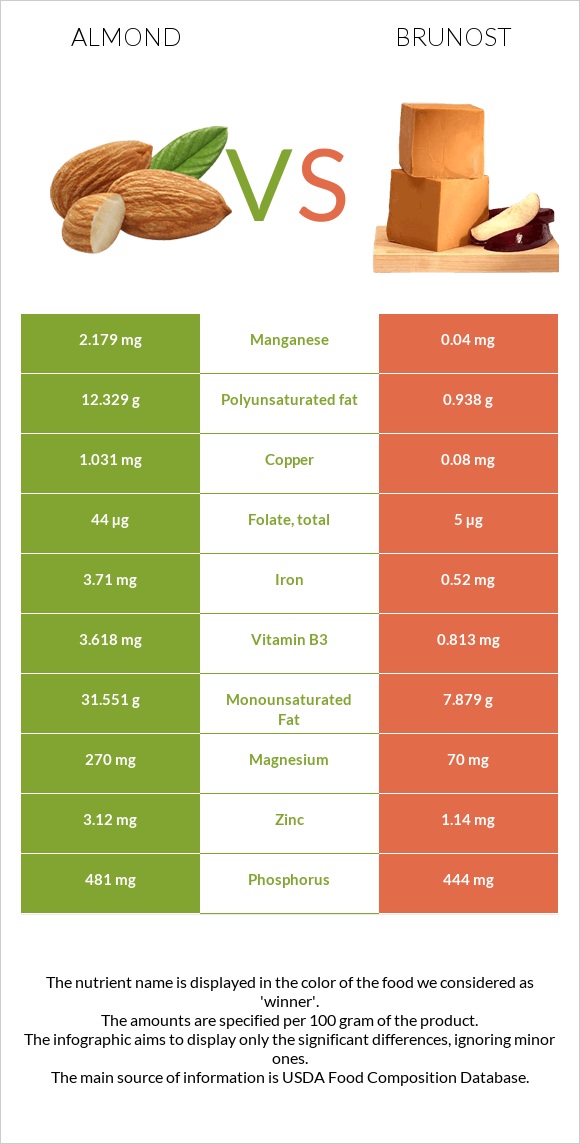
Important differences between almonds and brunost Almonds have more copper, manganese, fiber, magnesium, and iron; however, brunost is richer in vitamin B12 and vitamin B5. Almonds' daily need coverage for copper is 106% more. Almonds contain less saturated fat. Brunost has a higher glycemic index. The glycemic index of brunost is 27, while the glycemic index of almonds is 0. The food varieties used in the comparison are Nuts, almonds and Cheese, gjetost .
Infographic
Mineral Comparison
Mineral comparison score is based on the number of minerals by which one or the other food is richer. The "coverage" charts below show how much of the daily needs can be covered by 300 grams of the food.
6
100 g
300 g
1 almond - 1.2g 1 oz (23 whole kernels) - 28.35g 1 cup, sliced - 92g 1 cup, ground - 95g 1 cup, slivered - 108g 1 cup, whole - 143g
Magnesium
Magnesium
Calcium
Calcium
Potassium
Potassium
Iron
Iron
Copper
Copper
Zinc
Zinc
Phosphorus
Phosphorus
Sodium
Sodium
Manganese
Manganese
Selenium
Selenium
193%
81%
65%
139%
344%
85%
206%
0.13%
284%
22%
3
100 g
300 g
1 oz - 28.35g 1 package (8 oz) - 227g
Magnesium
Magnesium
Calcium
Calcium
Potassium
Potassium
Iron
Iron
Copper
Copper
Zinc
Zinc
Phosphorus
Phosphorus
Sodium
Sodium
Manganese
Manganese
Selenium
Selenium
50%
120%
124%
20%
27%
31%
190%
78%
5.2%
79%
Vitamin Comparison
Vitamin comparison score is based on the number of vitamins by which one or the other food is richer. The "coverage" charts below show how much of the daily needs can be covered by 300 grams of the food.
3
100 g
300 g
1 almond - 1.2g 1 oz (23 whole kernels) - 28.35g 1 cup, sliced - 92g 1 cup, ground - 95g 1 cup, slivered - 108g 1 cup, whole - 143g
Vitamin C
Vit. C
Vitamin D
Vit. D
Vitamin A
Vit. A
Vitamin E
Vit. E
Vitamin B1
Vit. B1
Vitamin B2
Vit. B2
Vitamin B3
Vit. B3
Vitamin B5
Vit. B5
Vitamin B6
Vit. B6
Vitamin B12
Vit. B12
Vitamin K
Vit. K
Folate
Folate
0%
0%
0%
513%
51%
263%
68%
28%
32%
0%
0%
33%
6
100 g
300 g
1 oz - 28.35g 1 package (8 oz) - 227g
Vitamin C
Vit. C
Vitamin D
Vit. D
Vitamin A
Vit. A
Vitamin E
Vit. E
Vitamin B1
Vit. B1
Vitamin B2
Vit. B2
Vitamin B3
Vit. B3
Vitamin B5
Vit. B5
Vitamin B6
Vit. B6
Vitamin B12
Vit. B12
Vitamin K
Vit. K
Folate
Folate
0%
0%
111%
0%
79%
319%
15%
201%
63%
303%
0%
3.8%
All nutrients comparison - raw data values
Nutrient
DV% diff.
Vitamin E
25.63mg
171%
Copper
1.031mg
0.08mg
106%
Vitamin B12
0µg
2.42µg
101%
Manganese
2.179mg
0.04mg
93%
Polyunsaturated fat
12.329g
0.938g
76%
Saturated fat
3.802g
19.16g
70%
Monounsaturated fat
31.551g
7.879g
59%
Vitamin B5
0.471mg
3.351mg
58%
Fiber
12.5g
0g
50%
Magnesium
270mg
70mg
48%
Iron
3.71mg
0.52mg
40%
Vitamin A
0µg
334µg
37%
Fats
49.93g
29.51g
31%
Cholesterol
0mg
94mg
31%
Sodium
1mg
600mg
26%
Protein
21.15g
9.65g
23%
Potassium
733mg
1409mg
20%
Selenium
4.1µg
14.5µg
19%
Vitamin B2
1.138mg
1.382mg
19%
Zinc
3.12mg
1.14mg
18%
Vitamin B3
3.618mg
0.813mg
18%
Calcium
269mg
400mg
13%
Vitamin B6
0.137mg
0.271mg
10%
Folate
44µg
5µg
10%
Vitamin B1
0.205mg
0.315mg
9%
Choline
52.1mg
9%
Carbs
21.55g
42.65g
7%
Calories
579kcal
466kcal
6%
Phosphorus
481mg
444mg
5%
Protein per 100 calories
3.7g
2.1g
N/A
Calories per 10 g protein
274kcal
483kcal
N/A
Weight per 100 calories
17g
21g
N/A
Unsaturated / Saturated Fat ratio
12
0.46
N/A
Net carbs
9.05g
42.65g
N/A
Sugar
4.35g
N/A
Starch
0.72g
0%
Trans fat
0.015g
N/A
Tryptophan
0.211mg
0.135mg
0%
Threonine
0.601mg
0.393mg
0%
Isoleucine
0.751mg
0.519mg
0%
Leucine
1.473mg
0.992mg
0%
Lysine
0.568mg
0.814mg
0%
Methionine
0.157mg
0.318mg
0%
Phenylalanine
1.132mg
0.54mg
0%
Valine
0.855mg
0.765mg
0%
Histidine
0.539mg
0.293mg
0%
Fructose
0.11g
0%
Omega-3 - ALA
0.003g
N/A
Omega-6 - Eicosadienoic acid
0.002g
N/A
Omega-6 - Linoleic acid
12.32g
N/A
Macronutrient Comparison
Macronutrient breakdown side-by-side comparison
2
21%
50%
22%
4%
3%
Protein:
21.15 g
Fats:
49.93 g
Carbs:
21.55 g
Water:
4.41 g
Other:
2.96 g
3
10%
30%
43%
13%
5%
Protein:
9.65 g
Fats:
29.51 g
Carbs:
42.65 g
Water:
13.44 g
Other:
4.75 g
Contains
more
Protein Protein
+119.2%
Contains
more
Fats Fats
+69.2%
Contains
more
Carbs Carbs
+97.9%
Contains
more
Water Water
+204.8%
Contains
more
Other Other
+60.5%
Fat Type Comparison
Fat type breakdown side-by-side comparison
3
8%
66%
26%
Saturated fat:
Sat. Fat
3.802 g
Monounsaturated fat:
Mono. Fat
31.551 g
Polyunsaturated fat:
Poly. Fat
12.329 g
0
68%
28%
3%
Saturated fat:
Sat. Fat
19.16 g
Monounsaturated fat:
Mono. Fat
7.879 g
Polyunsaturated fat:
Poly. Fat
0.938 g
Contains
less
Sat. Fat Saturated fat
-80.2%
Contains
more
Mono. Fat Monounsaturated fat
+300.4%
Contains
more
Poly. Fat Polyunsaturated fat
+1214.4%