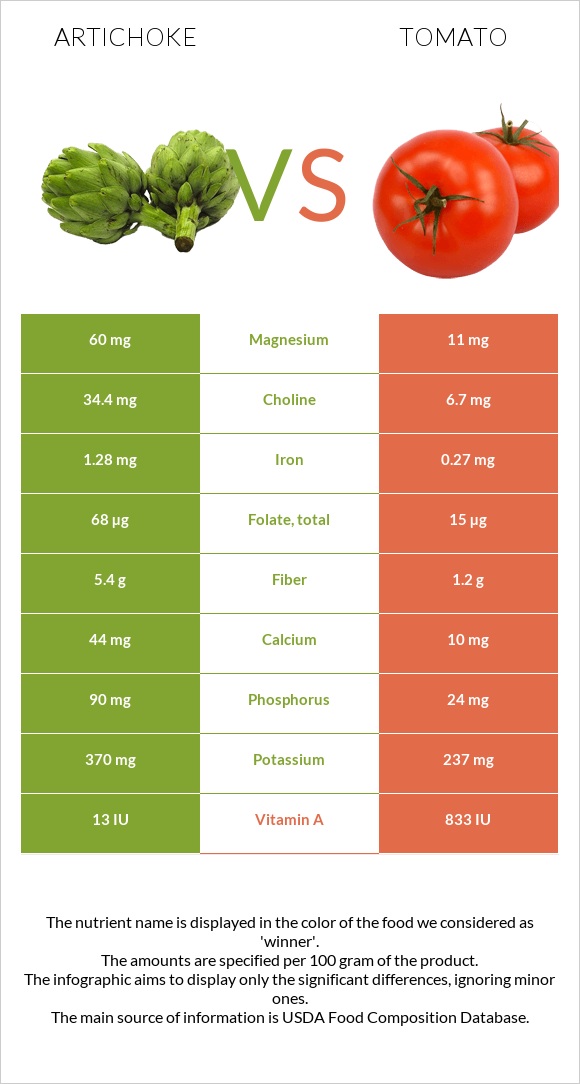
What are the main differences between artichoke and tomatoes? Artichoke is richer in copper, fiber, folate, iron, magnesium, phosphorus, manganese, vitamin K, and choline, while tomatoes are higher in vitamin A. Artichoke's daily need coverage for copper is 19% higher. Tomatoes have 5 times less magnesium than artichoke. Artichoke has 60mg of magnesium, while tomatoes have 11mg. We used Artichokes, (globe or french), raw and Tomatoes, red, ripe, raw, year round average types in this comparison.
Infographic
Mineral Comparison
Mineral comparison score is based on the number of minerals by which one or the other food is richer. The "coverage" charts below show how much of the daily needs can be covered by 300 grams of the food.
9
100 g
300 g
1 artichoke, medium - 128g 1 artichoke, large - 162g
Magnesium
Magnesium
Calcium
Calcium
Potassium
Potassium
Iron
Iron
Copper
Copper
Zinc
Zinc
Phosphorus
Phosphorus
Sodium
Sodium
Manganese
Manganese
Selenium
Selenium
43%
13%
33%
48%
77%
13%
39%
12%
33%
1.1%
1
100 g
300 g
1 slice, thin/small - 15g 1 cherry - 17g 1 slice, medium (1/4" thick) - 20g 1 slice, thick/large (1/2" thick) - 27g 1 wedge (1/4 of medium tomato) - 31g 1 Italian tomato - 62g 1 plum tomato - 62g 1 small whole (2-2/5" dia) - 91g 1 medium whole (2-3/5" dia) - 123g 1 NLEA serving - 148g 1 cup cherry tomatoes - 149g 1 cup, chopped or sliced - 180g 1 large whole (3" dia) - 182g
Magnesium
Magnesium
Calcium
Calcium
Potassium
Potassium
Iron
Iron
Copper
Copper
Zinc
Zinc
Phosphorus
Phosphorus
Sodium
Sodium
Manganese
Manganese
Selenium
Selenium
7.9%
3%
21%
10%
20%
4.6%
10%
0.65%
15%
0%
Vitamin Comparison
Vitamin comparison score is based on the number of vitamins by which one or the other food is richer. The "coverage" charts below show how much of the daily needs can be covered by 300 grams of the food.
7
100 g
300 g
1 artichoke, medium - 128g 1 artichoke, large - 162g
Vitamin C
Vit. C
Vitamin D
Vit. D
Vitamin A
Vit. A
Vitamin E
Vit. E
Vitamin B1
Vit. B1
Vitamin B2
Vit. B2
Vitamin B3
Vit. B3
Vitamin B5
Vit. B5
Vitamin B6
Vit. B6
Vitamin B12
Vit. B12
Vitamin K
Vit. K
Folate
Folate
39%
0%
0.33%
3.8%
18%
15%
20%
20%
27%
0%
37%
51%
3
100 g
300 g
1 slice, thin/small - 15g 1 cherry - 17g 1 slice, medium (1/4" thick) - 20g 1 slice, thick/large (1/2" thick) - 27g 1 wedge (1/4 of medium tomato) - 31g 1 Italian tomato - 62g 1 plum tomato - 62g 1 small whole (2-2/5" dia) - 91g 1 medium whole (2-3/5" dia) - 123g 1 NLEA serving - 148g 1 cup cherry tomatoes - 149g 1 cup, chopped or sliced - 180g 1 large whole (3" dia) - 182g
Vitamin C
Vit. C
Vitamin D
Vit. D
Vitamin A
Vit. A
Vitamin E
Vit. E
Vitamin B1
Vit. B1
Vitamin B2
Vit. B2
Vitamin B3
Vit. B3
Vitamin B5
Vit. B5
Vitamin B6
Vit. B6
Vitamin B12
Vit. B12
Vitamin K
Vit. K
Folate
Folate
46%
0%
14%
11%
9.3%
4.4%
11%
5.3%
18%
0%
20%
11%
All nutrients comparison - raw data values
Nutrient
DV% diff.
Copper
0.231mg
0.059mg
19%
Fiber
5.4g
1.2g
17%
Iron
1.28mg
0.27mg
13%
Folate
68µg
15µg
13%
Magnesium
60mg
11mg
12%
Phosphorus
90mg
24mg
9%
Manganese
0.256mg
0.114mg
6%
Vitamin K
14.8µg
7.9µg
6%
Protein
3.27g
0.88g
5%
Vitamin A
1µg
42µg
5%
Vitamin B5
0.338mg
0.089mg
5%
Choline
34.4mg
6.7mg
5%
Potassium
370mg
237mg
4%
Sodium
94mg
5mg
4%
Vitamin B2
0.066mg
0.019mg
4%
Calcium
44mg
10mg
3%
Zinc
0.49mg
0.17mg
3%
Vitamin B1
0.072mg
0.037mg
3%
Vitamin B3
1.046mg
0.594mg
3%
Vitamin B6
0.116mg
0.08mg
3%
Vitamin C
11.7mg
13.7mg
2%
Carbs
10.51g
3.89g
2%
Vitamin E
0.19mg
0.54mg
2%
Fructose
1.37g
2%
Calories
47kcal
18kcal
1%
Protein per 100 calories
7g
4.9g
N/A
Calories per 10 g protein
144kcal
205kcal
N/A
Weight per 100 calories
213g
556g
N/A
Fats
0.15g
0.2g
0%
Net carbs
5.11g
2.69g
N/A
Sugar
0.99g
2.63g
N/A
Selenium
0.2µg
0µg
0%
Saturated fat
0.036g
0.028g
0%
Monounsaturated fat
0.005g
0.031g
0%
Polyunsaturated fat
0.064g
0.083g
0%
Tryptophan
0.006mg
0%
Threonine
0.027mg
0%
Isoleucine
0.018mg
0%
Leucine
0.025mg
0%
Lysine
0.027mg
0%
Methionine
0.006mg
0%
Phenylalanine
0.027mg
0%
Valine
0.018mg
0%
Histidine
0.014mg
0%
Macronutrient Comparison
Macronutrient breakdown side-by-side comparison
3
3%
11%
85%
Protein:
3.27 g
Fats:
0.15 g
Carbs:
10.51 g
Water:
84.94 g
Other:
1.13 g
2
4%
95%
Protein:
0.88 g
Fats:
0.2 g
Carbs:
3.89 g
Water:
94.52 g
Other:
0.51 g
Contains
more
Protein Protein
+271.6%
Contains
more
Carbs Carbs
+170.2%
Contains
more
Other Other
+121.6%
Contains
more
Fats Fats
+33.3%
Contains
more
Water Water
+11.3%
Fat Type Comparison
Fat type breakdown side-by-side comparison
0
34%
5%
61%
Saturated fat:
Sat. Fat
0.036 g
Monounsaturated fat:
Mono. Fat
0.005 g
Polyunsaturated fat:
Poly. Fat
0.064 g
3
20%
22%
58%
Saturated fat:
Sat. Fat
0.028 g
Monounsaturated fat:
Mono. Fat
0.031 g
Polyunsaturated fat:
Poly. Fat
0.083 g
Contains
less
Sat. Fat Saturated fat
-22.2%
Contains
more
Mono. Fat Monounsaturated fat
+520%
Contains
more
Poly. Fat Polyunsaturated fat
+29.7%