Aspartame vs. Crunch bar — In-Depth Nutrition Comparison
Compare
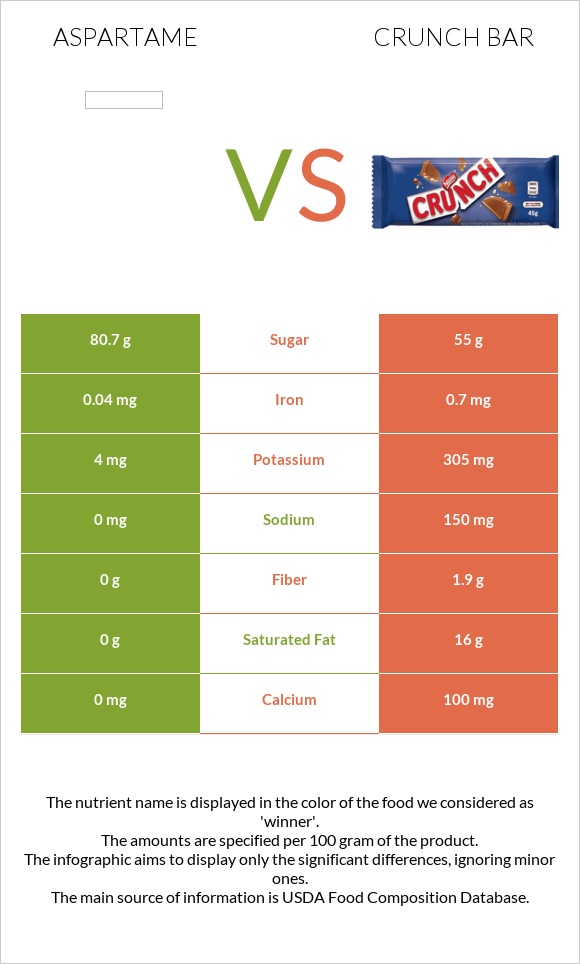
Important differences between aspartame and crunch bar
- Aspartame has less calcium, potassium, iron, and fiber.
- Crunch bar's daily need coverage for saturated fat is 80% more.
The food varieties used in the comparison are Sweeteners, tabletop, aspartame, EQUAL, packets and Candies, NESTLE, CRUNCH Bar, and Dessert Topping.
Infographic
Infographic link
Mineral Comparison
Mineral comparison score is based on the number of minerals by which one or the other food is richer. The "coverage" charts below show how much of the daily needs can be covered by 300 grams of the food.
| Contains more ZincZinc | +∞% |
| Contains less SodiumSodium | -100% |
| Contains more SeleniumSelenium | +∞% |
| Contains more CalciumCalcium | +∞% |
| Contains more PotassiumPotassium | +7525% |
| Contains more IronIron | +1650% |
Vitamin Comparison
Vitamin comparison score is based on the number of vitamins by which one or the other food is richer. The "coverage" charts below show how much of the daily needs can be covered by 300 grams of the food.
| Contains more Vitamin CVitamin C | +∞% |
All nutrients comparison - raw data values
| Nutrient |  |
 |
DV% diff. |
| Saturated fat | 0g | 16g | 73% |
| Fats | 0g | 26g | 40% |
| Calcium | 0mg | 100mg | 10% |
| Potassium | 4mg | 305mg | 9% |
| Iron | 0.04mg | 0.7mg | 8% |
| Fiber | 0g | 1.9g | 8% |
| Caffeine | 0mg | 30mg | 8% |
| Calories | 365kcal | 500kcal | 7% |
| Carbs | 89.08g | 67g | 7% |
| Sodium | 0mg | 150mg | 7% |
| Protein | 2.17g | 5g | 6% |
| Cholesterol | 0mg | 13mg | 4% |
| Starch | 8.36g | 3% | |
| Vitamin C | 0mg | 0.5mg | 1% |
| Selenium | 0.5µg | 1% | |
| Net carbs | 89.08g | 65.1g | N/A |
| Sugar | 80.7g | 55g | N/A |
| Zinc | 0.01mg | 0% | |
| Trans fat | 0.137g | N/A | |
| Phenylalanine | 1.186mg | 0% |
Macronutrient Comparison
Macronutrient breakdown side-by-side comparison
Protein:
2.17 g
Fats:
0 g
Carbs:
89.08 g
Water:
8.75 g
Other:
0 g
Protein:
5 g
Fats:
26 g
Carbs:
67 g
Water:
0.65 g
Other:
1.35 g
| Contains more CarbsCarbs | +33% |
| Contains more WaterWater | +1246.2% |
| Contains more ProteinProtein | +130.4% |
| Contains more FatsFats | +∞% |
| Contains more OtherOther | +∞% |


