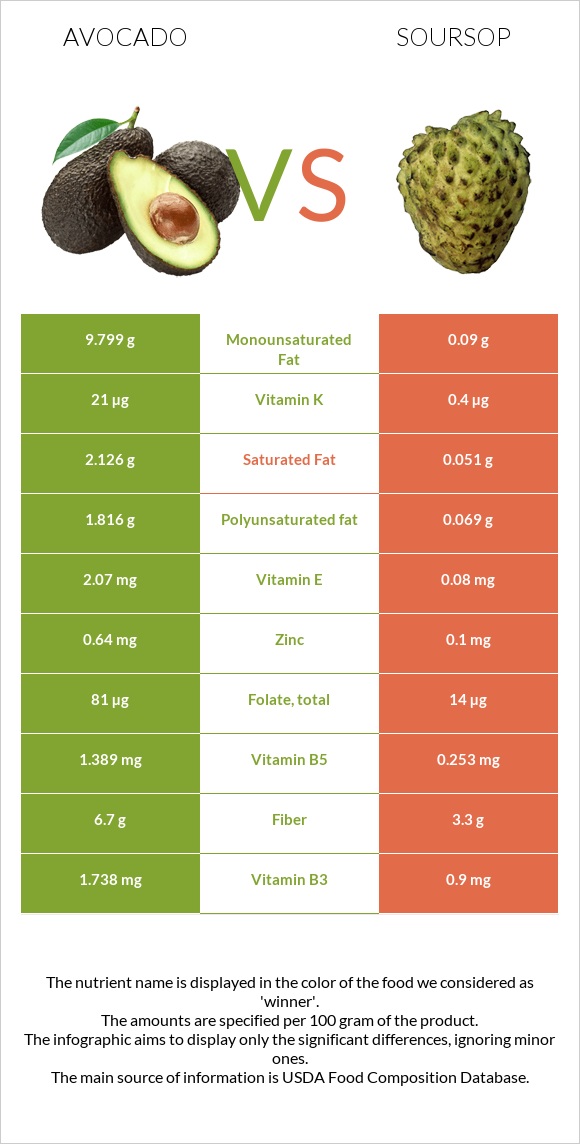
Important differences between avocados and soursop Avocados have more vitamin B5, vitamin K, folate, vitamin B6, fiber, vitamin E, copper, and vitamin B2; however, soursop has more vitamin C. Avocados' daily need coverage for vitamin B5 is 23% more. Avocados have 53 times more vitamin K than soursop. Avocados have 21µg of vitamin K, while soursop has 0.4µg. Soursop is lower in saturated fat. The food varieties used in the comparison are Avocados, raw, all commercial varieties and Soursop, raw .
Infographic
Mineral Comparison
Mineral comparison score is based on the number of minerals by which one or the other food is richer. The "coverage" charts below show how much of the daily needs can be covered by 300 grams of the food.
7
100 g
300 g
1 cup, sliced - 146g 1 cup, cubes - 150g 1 avocado, NS as to Florida or California - 201g 1 cup, pureed - 230g
Magnesium
Magnesium
Calcium
Calcium
Potassium
Potassium
Iron
Iron
Copper
Copper
Zinc
Zinc
Phosphorus
Phosphorus
Sodium
Sodium
Manganese
Manganese
Selenium
Selenium
21%
3.6%
43%
21%
63%
17%
22%
0.91%
19%
2.2%
2
100 g
300 g
1 cup, pulp - 225g 1 fruit (7" x 5-1/4" dia) - 625g
Magnesium
Magnesium
Calcium
Calcium
Potassium
Potassium
Iron
Iron
Copper
Copper
Zinc
Zinc
Phosphorus
Phosphorus
Sodium
Sodium
Manganese
Manganese
Selenium
Selenium
15%
4.2%
25%
23%
29%
2.7%
12%
1.8%
0%
3.3%
Vitamin Comparison
Vitamin comparison score is based on the number of vitamins by which one or the other food is richer. The "coverage" charts below show how much of the daily needs can be covered by 300 grams of the food.
8
100 g
300 g
1 cup, sliced - 146g 1 cup, cubes - 150g 1 avocado, NS as to Florida or California - 201g 1 cup, pureed - 230g
Vitamin C
Vit. C
Vitamin D
Vit. D
Vitamin A
Vit. A
Vitamin E
Vit. E
Vitamin B1
Vit. B1
Vitamin B2
Vit. B2
Vitamin B3
Vit. B3
Vitamin B5
Vit. B5
Vitamin B6
Vit. B6
Vitamin B12
Vit. B12
Vitamin K
Vit. K
Folate
Folate
33%
0%
2.3%
41%
17%
30%
33%
83%
59%
0%
53%
61%
1
100 g
300 g
1 cup, pulp - 225g 1 fruit (7" x 5-1/4" dia) - 625g
Vitamin C
Vit. C
Vitamin D
Vit. D
Vitamin A
Vit. A
Vitamin E
Vit. E
Vitamin B1
Vit. B1
Vitamin B2
Vit. B2
Vitamin B3
Vit. B3
Vitamin B5
Vit. B5
Vitamin B6
Vit. B6
Vitamin B12
Vit. B12
Vitamin K
Vit. K
Folate
Folate
69%
0%
0%
1.6%
18%
12%
17%
15%
14%
0%
1%
11%
All nutrients comparison - raw data values
Nutrient
DV% diff.
Monounsaturated fat
9.799g
0.09g
24%
Vitamin B5
1.389mg
0.253mg
23%
Fats
14.66g
0.3g
22%
Vitamin K
21µg
0.4µg
17%
Folate
81µg
14µg
17%
Vitamin B6
0.257mg
0.059mg
15%
Fiber
6.7g
3.3g
14%
Vitamin E
2.07mg
0.08mg
13%
Vitamin C
10mg
20.6mg
12%
Copper
0.19mg
0.086mg
12%
Polyunsaturated fat
1.816g
0.069g
12%
Saturated fat
2.126g
0.051g
9%
Potassium
485mg
278mg
6%
Manganese
0.142mg
6%
Vitamin B2
0.13mg
0.05mg
6%
Calories
160kcal
66kcal
5%
Zinc
0.64mg
0.1mg
5%
Vitamin B3
1.738mg
0.9mg
5%
Phosphorus
52mg
27mg
4%
Carbs
8.53g
16.84g
3%
Protein
2g
1g
2%
Magnesium
29mg
21mg
2%
Iron
0.55mg
0.6mg
1%
Vitamin A
7µg
0µg
1%
Choline
14.2mg
7.6mg
1%
Protein per 100 calories
1.3g
1.5g
N/A
Calories per 10 g protein
800kcal
660kcal
N/A
Weight per 100 calories
63g
152g
N/A
Unsaturated / Saturated Fat ratio
5.5
3.1
N/A
Net carbs
1.83g
13.54g
N/A
Calcium
12mg
14mg
0%
Sugar
0.66g
13.54g
N/A
Starch
0.11g
0%
Sodium
7mg
14mg
0%
Selenium
0.4µg
0.6µg
0%
Vitamin B1
0.067mg
0.07mg
0%
Tryptophan
0.025mg
0.011mg
0%
Threonine
0.073mg
0%
Isoleucine
0.084mg
0%
Leucine
0.143mg
0%
Lysine
0.132mg
0.06mg
0%
Methionine
0.038mg
0.007mg
0%
Phenylalanine
0.097mg
0%
Valine
0.107mg
0%
Histidine
0.049mg
0%
Fructose
0.12g
0%
Omega-3 - ALA
0.111g
N/A
Omega-6 - Gamma-linoleic acid
0.015g
N/A
Macronutrient Comparison
Macronutrient breakdown side-by-side comparison
3
2%
15%
9%
73%
Protein:
2 g
Fats:
14.66 g
Carbs:
8.53 g
Water:
73.23 g
Other:
1.58 g
2
17%
81%
Protein:
1 g
Fats:
0.3 g
Carbs:
16.84 g
Water:
81.16 g
Other:
0.7 g
Contains
more
Protein Protein
+100%
Contains
more
Fats Fats
+4786.7%
Contains
more
Other Other
+125.7%
Contains
more
Carbs Carbs
+97.4%
Contains
more
Water Water
+10.8%
Fat Type Comparison
Fat type breakdown side-by-side comparison
2
15%
71%
13%
Saturated fat:
Sat. Fat
2.126 g
Monounsaturated fat:
Mono. Fat
9.799 g
Polyunsaturated fat:
Poly. Fat
1.816 g
1
24%
43%
33%
Saturated fat:
Sat. Fat
0.051 g
Monounsaturated fat:
Mono. Fat
0.09 g
Polyunsaturated fat:
Poly. Fat
0.069 g
Contains
more
Mono. Fat Monounsaturated fat
+10787.8%
Contains
more
Poly. Fat Polyunsaturated fat
+2531.9%
Contains
less
Sat. Fat Saturated fat
-97.6%