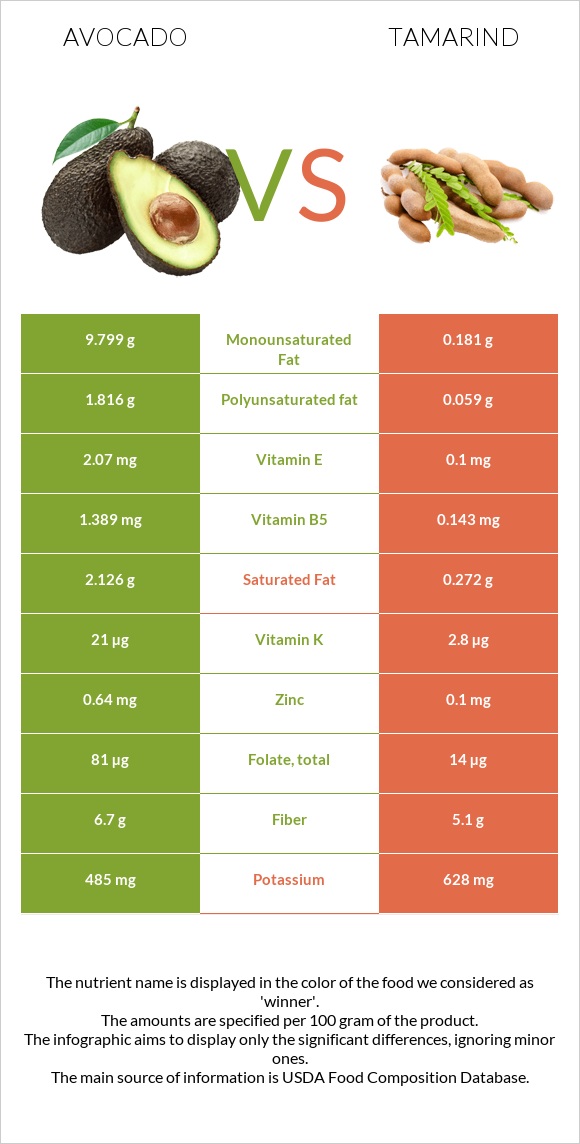
How are avocados and tamarind different? Avocados are higher in vitamin B5, folate, vitamin K, vitamin B6, vitamin E, and copper; however, tamarind is richer in vitamin B1, iron, and magnesium. Daily need coverage for vitamin B1 for tamarind is 30% higher. Avocados contain 21 times more vitamin E than tamarind. While avocados contain 2.07mg of vitamin E, tamarind contains only 0.1mg. Tamarind has less saturated fat. Tamarind has a lower glycemic index (23) than avocados (40). Avocados, raw, all commercial varieties and Tamarinds, raw are the varieties used in this article.
Infographic
Mineral Comparison
Mineral comparison score is based on the number of minerals by which one or the other food is richer. The "coverage" charts below show how much of the daily needs can be covered by 300 grams of the food.
4
100 g
300 g
1 cup, sliced - 146g 1 cup, cubes - 150g 1 avocado, NS as to Florida or California - 201g 1 cup, pureed - 230g
Magnesium
Magnesium
Calcium
Calcium
Potassium
Potassium
Iron
Iron
Copper
Copper
Zinc
Zinc
Phosphorus
Phosphorus
Sodium
Sodium
Manganese
Manganese
Selenium
Selenium
21%
3.6%
43%
21%
63%
17%
22%
0.91%
19%
2.2%
6
100 g
300 g
1 fruit (3" x 1") - 2g 1 cup, pulp - 120g
Magnesium
Magnesium
Calcium
Calcium
Potassium
Potassium
Iron
Iron
Copper
Copper
Zinc
Zinc
Phosphorus
Phosphorus
Sodium
Sodium
Manganese
Manganese
Selenium
Selenium
66%
22%
55%
105%
29%
2.7%
48%
3.7%
0%
7.1%
Vitamin Comparison
Vitamin comparison score is based on the number of vitamins by which one or the other food is richer. The "coverage" charts below show how much of the daily needs can be covered by 300 grams of the food.
7
100 g
300 g
1 cup, sliced - 146g 1 cup, cubes - 150g 1 avocado, NS as to Florida or California - 201g 1 cup, pureed - 230g
Vitamin C
Vit. C
Vitamin D
Vit. D
Vitamin A
Vit. A
Vitamin E
Vit. E
Vitamin B1
Vit. B1
Vitamin B2
Vit. B2
Vitamin B3
Vit. B3
Vitamin B5
Vit. B5
Vitamin B6
Vit. B6
Vitamin B12
Vit. B12
Vitamin K
Vit. K
Folate
Folate
33%
0%
2.3%
41%
17%
30%
33%
83%
59%
0%
53%
61%
3
100 g
300 g
1 fruit (3" x 1") - 2g 1 cup, pulp - 120g
Vitamin C
Vit. C
Vitamin D
Vit. D
Vitamin A
Vit. A
Vitamin E
Vit. E
Vitamin B1
Vit. B1
Vitamin B2
Vit. B2
Vitamin B3
Vit. B3
Vitamin B5
Vit. B5
Vitamin B6
Vit. B6
Vitamin B12
Vit. B12
Vitamin K
Vit. K
Folate
Folate
12%
0%
0.67%
2%
107%
35%
36%
8.6%
15%
0%
7%
11%
All nutrients comparison - raw data values
Nutrient
DV% diff.
Vitamin B1
0.067mg
0.428mg
30%
Iron
0.55mg
2.8mg
28%
Vitamin B5
1.389mg
0.143mg
25%
Monounsaturated fat
9.799g
0.181g
24%
Fats
14.66g
0.6g
22%
Carbs
8.53g
62.5g
18%
Folate
81µg
14µg
17%
Magnesium
29mg
92mg
15%
Vitamin B6
0.257mg
0.066mg
15%
Vitamin K
21µg
2.8µg
15%
Vitamin E
2.07mg
0.1mg
13%
Copper
0.19mg
0.086mg
12%
Polyunsaturated fat
1.816g
0.059g
12%
Phosphorus
52mg
113mg
9%
Saturated fat
2.126g
0.272g
8%
Vitamin C
10mg
3.5mg
7%
Calcium
12mg
74mg
6%
Fiber
6.7g
5.1g
6%
Manganese
0.142mg
6%
Zinc
0.64mg
0.1mg
5%
Calories
160kcal
239kcal
4%
Potassium
485mg
628mg
4%
Protein
2g
2.8g
2%
Selenium
0.4µg
1.3µg
2%
Vitamin B2
0.13mg
0.152mg
2%
Sodium
7mg
28mg
1%
Vitamin A
7µg
2µg
1%
Vitamin B3
1.738mg
1.938mg
1%
Choline
14.2mg
8.6mg
1%
Protein per 100 calories
1.3g
1.2g
N/A
Calories per 10 g protein
800kcal
854kcal
N/A
Weight per 100 calories
63g
42g
N/A
Unsaturated / Saturated Fat ratio
5.5
0.88
N/A
Net carbs
1.83g
57.4g
N/A
Sugar
0.66g
38.8g
N/A
Starch
0.11g
0%
Tryptophan
0.025mg
0.018mg
0%
Threonine
0.073mg
0%
Isoleucine
0.084mg
0%
Leucine
0.143mg
0%
Lysine
0.132mg
0.139mg
0%
Methionine
0.038mg
0.014mg
0%
Phenylalanine
0.097mg
0%
Valine
0.107mg
0%
Histidine
0.049mg
0%
Fructose
0.12g
0%
Omega-3 - ALA
0.111g
N/A
Omega-6 - Gamma-linoleic acid
0.015g
N/A
Macronutrient Comparison
Macronutrient breakdown side-by-side comparison
2
2%
15%
9%
73%
Protein:
2 g
Fats:
14.66 g
Carbs:
8.53 g
Water:
73.23 g
Other:
1.58 g
3
3%
63%
31%
3%
Protein:
2.8 g
Fats:
0.6 g
Carbs:
62.5 g
Water:
31.4 g
Other:
2.7 g
Contains
more
Fats Fats
+2343.3%
Contains
more
Water Water
+133.2%
Contains
more
Protein Protein
+40%
Contains
more
Carbs Carbs
+632.7%
Contains
more
Other Other
+70.9%
Fat Type Comparison
Fat type breakdown side-by-side comparison
2
15%
71%
13%
Saturated fat:
Sat. Fat
2.126 g
Monounsaturated fat:
Mono. Fat
9.799 g
Polyunsaturated fat:
Poly. Fat
1.816 g
1
53%
35%
12%
Saturated fat:
Sat. Fat
0.272 g
Monounsaturated fat:
Mono. Fat
0.181 g
Polyunsaturated fat:
Poly. Fat
0.059 g
Contains
more
Mono. Fat Monounsaturated fat
+5313.8%
Contains
more
Poly. Fat Polyunsaturated fat
+2978%
Contains
less
Sat. Fat Saturated fat
-87.2%