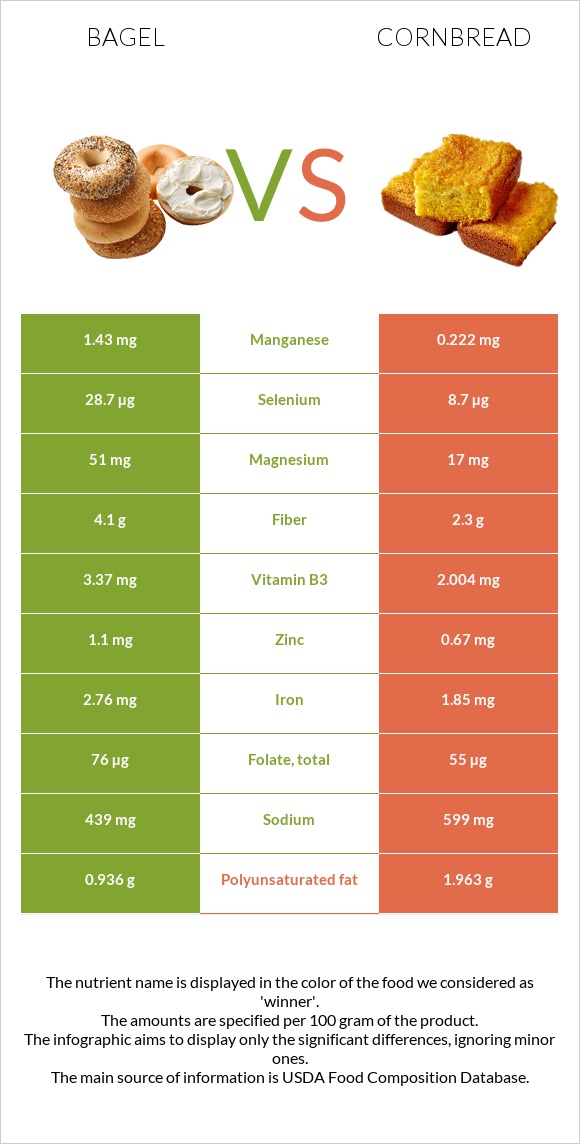
Differences between bagel and cornbread Bagel has more manganese, selenium, vitamin B1, iron, and copper, while cornbread has more phosphorus, calcium, and vitamin B12. Bagel's daily need coverage for manganese is 53% higher. Cornbread contains 3 times less selenium than bagel. Bagel contains 28.7µg of selenium, while cornbread contains 8.7µg. The food types used in this comparison are Bagels, wheat and Bread, cornbread, dry mix, prepared with 2% milk, 80% margarine, and eggs .
Infographic
Mineral Comparison
Mineral comparison score is based on the number of minerals by which one or the other food is richer. The "coverage" charts below show how much of the daily needs can be covered by 300 grams of the food.
8
100 g
300 g
1 bagel - 98g
Magnesium
Magnesium
Calcium
Calcium
Potassium
Potassium
Iron
Iron
Copper
Copper
Zinc
Zinc
Phosphorus
Phosphorus
Sodium
Sodium
Manganese
Manganese
Selenium
Selenium
36%
6%
15%
104%
58%
30%
61%
57%
187%
157%
2
100 g
300 g
1 oz - 28.35g 1 muffin - 51g 1 piece - 60g
Magnesium
Magnesium
Calcium
Calcium
Potassium
Potassium
Iron
Iron
Copper
Copper
Zinc
Zinc
Phosphorus
Phosphorus
Sodium
Sodium
Manganese
Manganese
Selenium
Selenium
12%
41%
12%
69%
24%
18%
168%
78%
29%
47%
Vitamin Comparison
Vitamin comparison score is based on the number of vitamins by which one or the other food is richer. The "coverage" charts below show how much of the daily needs can be covered by 300 grams of the food.
5
100 g
300 g
1 bagel - 98g
Vitamin C
Vit. C
Vitamin D
Vit. D
Vitamin A
Vit. A
Vitamin E
Vit. E
Vitamin B1
Vit. B1
Vitamin B2
Vit. B2
Vitamin B3
Vit. B3
Vitamin B5
Vit. B5
Vitamin B6
Vit. B6
Vitamin B12
Vit. B12
Vitamin K
Vit. K
Folate
Folate
0%
0%
0%
6.4%
101%
48%
63%
23%
34%
0%
3.8%
57%
6
100 g
300 g
1 oz - 28.35g 1 muffin - 51g 1 piece - 60g
Vitamin C
Vit. C
Vitamin D
Vit. D
Vitamin A
Vit. A
Vitamin E
Vit. E
Vitamin B1
Vit. B1
Vitamin B2
Vit. B2
Vitamin B3
Vit. B3
Vitamin B5
Vit. B5
Vitamin B6
Vit. B6
Vitamin B12
Vit. B12
Vitamin K
Vit. K
Folate
Folate
0.33%
0%
12%
10%
48%
40%
38%
35%
20%
29%
9.3%
41%
All nutrients comparison - raw data values
Nutrient
DV% diff.
Manganese
1.43mg
0.222mg
53%
Phosphorus
142mg
391mg
36%
Selenium
28.7µg
8.7µg
36%
Cholesterol
0mg
57mg
19%
Vitamin B1
0.403mg
0.19mg
18%
Saturated fat
0g
3.732g
17%
Starch
35.66g
15%
Fats
1.53g
9.58g
12%
Calcium
20mg
135mg
12%
Iron
2.76mg
1.85mg
11%
Copper
0.175mg
0.073mg
11%
Vitamin B12
0µg
0.23µg
10%
Vitamin B3
3.37mg
2.004mg
9%
Choline
9.8mg
58.7mg
9%
Magnesium
51mg
17mg
8%
Monounsaturated fat
0.29g
3.494g
8%
Protein
10.2g
6.59g
7%
Fiber
4.1g
2.3g
7%
Sodium
439mg
599mg
7%
Polyunsaturated fat
0.936g
1.963g
7%
Vitamin B6
0.147mg
0.085mg
5%
Folate
76µg
55µg
5%
Calories
250kcal
330kcal
4%
Zinc
1.1mg
0.67mg
4%
Vitamin A
0µg
35µg
4%
Vitamin B5
0.375mg
0.579mg
4%
Vitamin B2
0.209mg
0.175mg
3%
Carbs
48.89g
54.46g
2%
Vitamin K
1.5µg
3.7µg
2%
Potassium
165mg
133mg
1%
Vitamin E
0.32mg
0.51mg
1%
Protein per 100 calories
4.1g
2g
N/A
Calories per 10 g protein
245kcal
501kcal
N/A
Weight per 100 calories
40g
30g
N/A
Unsaturated / Saturated Fat ratio
1.5
N/A
Vitamin C
0mg
0.1mg
0%
Net carbs
44.79g
52.16g
N/A
Sugar
6.12g
16.05g
N/A
Trans fat
0g
0.224g
N/A
Tryptophan
0.059mg
0%
Threonine
0.226mg
0%
Isoleucine
0.265mg
0%
Leucine
0.658mg
0%
Lysine
0.324mg
0%
Methionine
0.157mg
0%
Phenylalanine
0.343mg
0%
Valine
0.334mg
0%
Histidine
0.167mg
0%
Fructose
0.2g
0%
Omega-3 - DHA
0g
0.007g
N/A
Omega-3 - ALA
0.076g
N/A
Omega-3 - DPA
0g
0.003g
N/A
Omega-3 - Eicosatrienoic acid
0.004g
N/A
Omega-6 - Gamma-linoleic acid
0.004g
N/A
Omega-6 - Dihomo-gamma-linoleic acid
0.009g
N/A
Omega-6 - Eicosadienoic acid
0g
0.043g
N/A
Omega-6 - Linoleic acid
1.726g
N/A
Macronutrient Comparison
Macronutrient breakdown side-by-side comparison
2
10%
49%
38%
2%
Protein:
10.2 g
Fats:
1.53 g
Carbs:
48.89 g
Water:
37.55 g
Other:
1.83 g
3
7%
10%
54%
27%
2%
Protein:
6.59 g
Fats:
9.58 g
Carbs:
54.46 g
Water:
27.11 g
Other:
2.26 g
Contains
more
Protein Protein
+54.8%
Contains
more
Water Water
+38.5%
Contains
more
Fats Fats
+526.1%
Contains
more
Carbs Carbs
+11.4%
Contains
more
Other Other
+23.5%
Fat Type Comparison
Fat type breakdown side-by-side comparison
1
24%
76%
Saturated fat:
Sat. Fat
0 g
Monounsaturated fat:
Mono. Fat
0.29 g
Polyunsaturated fat:
Poly. Fat
0.936 g
2
41%
38%
21%
Saturated fat:
Sat. Fat
3.732 g
Monounsaturated fat:
Mono. Fat
3.494 g
Polyunsaturated fat:
Poly. Fat
1.963 g
Contains
less
Sat. Fat Saturated fat
-100%
Contains
more
Mono. Fat Monounsaturated fat
+1104.8%
Contains
more
Poly. Fat Polyunsaturated fat
+109.7%