Biscuit vs. Barbecue chicken — In-Depth Nutrition Comparison
Compare
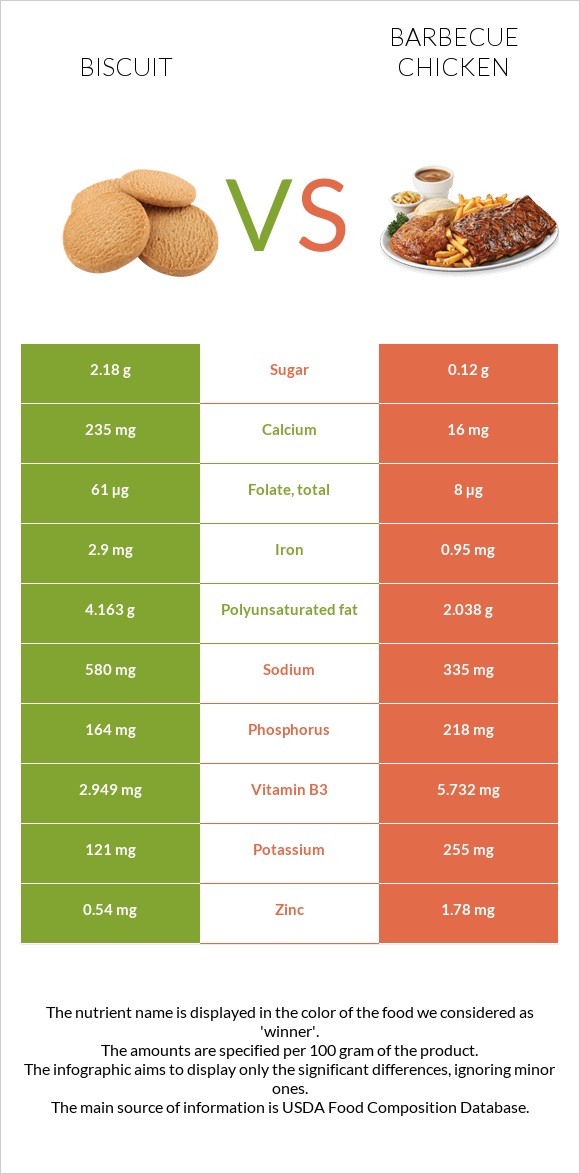
What are the differences between biscuits and barbecue chicken?
- Biscuits are higher in vitamin B1, iron, calcium, manganese, and folate, yet barbecue chicken is higher in vitamin B3, vitamin B12, vitamin B6, and zinc.
- Barbecue chicken's daily need coverage for cholesterol is 41% more.
- Biscuits have 76 times more manganese than barbecue chicken. While biscuits have 0.378mg of manganese, barbecue chicken has only 0.005mg.
- The amount of cholesterol in biscuits is lower.
- The glycemic index of barbecue chicken is lower.
We used Biscuits, plain or buttermilk, prepared from recipe and Chicken, broiler, rotisserie, BBQ, thigh meat, and skin types in this article.
Infographic
Infographic link
Mineral Comparison
Mineral comparison score is based on the number of minerals by which one or the other food is richer. The "coverage" charts below show how much of the daily needs can be covered by 300 grams of the food.
| Contains more CalciumCalcium | +1368.8% |
| Contains more IronIron | +205.3% |
| Contains more ManganeseManganese | +7460% |
| Contains more MagnesiumMagnesium | +16.7% |
| Contains more PotassiumPotassium | +110.7% |
| Contains more ZincZinc | +229.6% |
| Contains more PhosphorusPhosphorus | +32.9% |
| Contains less SodiumSodium | -42.2% |
| Contains more SeleniumSelenium | +12.8% |
Vitamin Comparison
Vitamin comparison score is based on the number of vitamins by which one or the other food is richer. The "coverage" charts below show how much of the daily needs can be covered by 300 grams of the food.
| Contains more Vitamin CVitamin C | +∞% |
| Contains more Vitamin B1Vitamin B1 | +547.3% |
| Contains more Vitamin B2Vitamin B2 | +36.6% |
| Contains more Vitamin B5Vitamin B5 | +87.5% |
| Contains more FolateFolate | +662.5% |
| Contains more Vitamin B3Vitamin B3 | +94.4% |
| Contains more Vitamin B6Vitamin B6 | +445.7% |
| Contains more Vitamin B12Vitamin B12 | +487.5% |
All nutrients comparison - raw data values
| Nutrient |  |
 |
DV% diff. |
| Cholesterol | 3mg | 127mg | 41% |
| Protein | 7g | 22.51g | 31% |
| Vitamin B1 | 0.356mg | 0.055mg | 25% |
| Iron | 2.9mg | 0.95mg | 24% |
| Calcium | 235mg | 16mg | 22% |
| Vitamin B3 | 2.949mg | 5.732mg | 17% |
| Manganese | 0.378mg | 0.005mg | 16% |
| Vitamin B12 | 0.08µg | 0.47µg | 16% |
| Carbs | 44.6g | 0.12g | 15% |
| Polyunsaturated fat | 4.163g | 2.038g | 14% |
| Folate | 61µg | 8µg | 13% |
| Vitamin B6 | 0.035mg | 0.191mg | 12% |
| Zinc | 0.54mg | 1.78mg | 11% |
| Sodium | 580mg | 335mg | 11% |
| Choline | 62.9mg | 11% | |
| Phosphorus | 164mg | 218mg | 8% |
| Calories | 353kcal | 226kcal | 6% |
| Fiber | 1.5g | 0g | 6% |
| Vitamin B2 | 0.31mg | 0.227mg | 6% |
| Selenium | 19.5µg | 22µg | 5% |
| Potassium | 121mg | 255mg | 4% |
| Vitamin E | 0.46mg | 3% | |
| Vitamin B5 | 0.285mg | 0.152mg | 3% |
| Fats | 16.3g | 15.08g | 2% |
| Vitamin A | 20µg | 2% | |
| Saturated fat | 4.324g | 3.927g | 2% |
| Magnesium | 18mg | 21mg | 1% |
| Copper | 0.082mg | 0.077mg | 1% |
| Monounsaturated fat | 6.93g | 6.446g | 1% |
| Vitamin C | 0.2mg | 0mg | 0% |
| Net carbs | 43.1g | 0.12g | N/A |
| Sugar | 2.18g | 0.12g | N/A |
| Trans fat | 0.078g | N/A | |
| Tryptophan | 0.087mg | 0.173mg | 0% |
| Threonine | 0.211mg | 0.657mg | 0% |
| Isoleucine | 0.273mg | 0.853mg | 0% |
| Leucine | 0.514mg | 1.549mg | 0% |
| Lysine | 0.226mg | 1.75mg | 0% |
| Methionine | 0.132mg | 0.565mg | 0% |
| Phenylalanine | 0.347mg | 0.69mg | 0% |
| Valine | 0.313mg | 0.935mg | 0% |
| Histidine | 0.161mg | 0.592mg | 0% |
| Fructose | 0.04g | 0% | |
| Omega-6 - Eicosadienoic acid | 0.011g | N/A |
Macronutrient Comparison
Macronutrient breakdown side-by-side comparison
Protein:
7 g
Fats:
16.3 g
Carbs:
44.6 g
Water:
28.9 g
Other:
3.2 g
Protein:
22.51 g
Fats:
15.08 g
Carbs:
0.12 g
Water:
61.41 g
Other:
0.88 g
| Contains more CarbsCarbs | +37066.7% |
| Contains more OtherOther | +263.6% |
| Contains more ProteinProtein | +221.6% |
| Contains more WaterWater | +112.5% |
~equal in
Fats
~15.08g
Fat Type Comparison
Fat type breakdown side-by-side comparison
Saturated fat:
Sat. Fat
4.324 g
Monounsaturated fat:
Mono. Fat
6.93 g
Polyunsaturated fat:
Poly. Fat
4.163 g
Saturated fat:
Sat. Fat
3.927 g
Monounsaturated fat:
Mono. Fat
6.446 g
Polyunsaturated fat:
Poly. Fat
2.038 g
| Contains more Poly. FatPolyunsaturated fat | +104.3% |
~equal in
Saturated fat
~3.927g
~equal in
Monounsaturated fat
~6.446g


