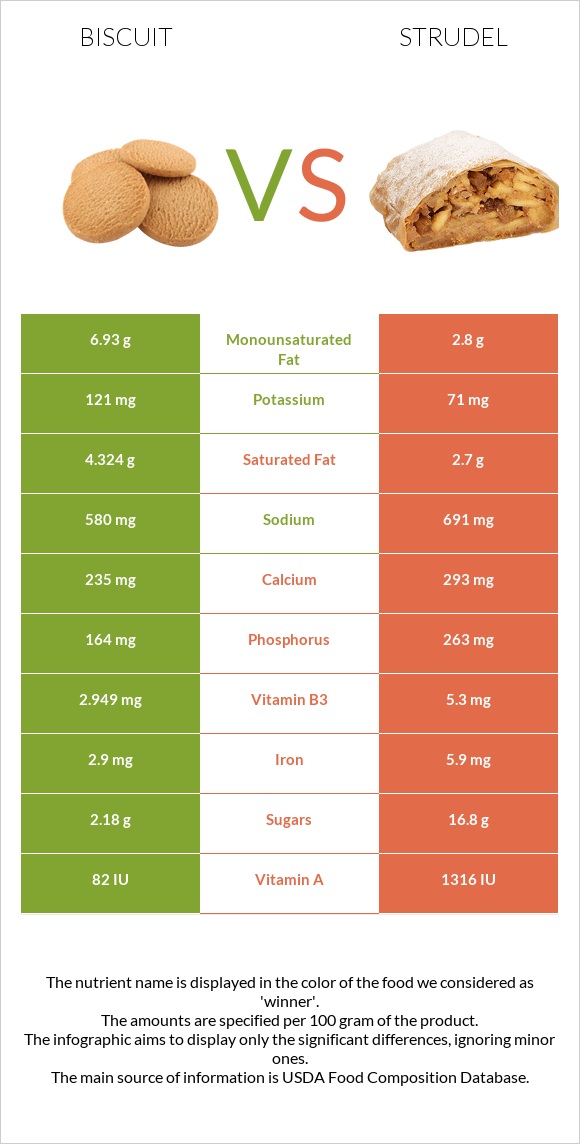
The main differences between biscuits and strudel Strudel is richer than biscuits in vitamin B12, vitamin B6, iron, vitamin A, vitamin B3, phosphorus, vitamin B2, and calcium. Daily need coverage for vitamin B12 for strudel is 63% higher. Biscuits contain 2 times more saturated fat than strudel. Biscuits contain 4.324g of saturated fat, while strudel contains 2.7g. Biscuits have a lower glycemic index than strudel. Food types used in this article are Biscuits, plain or buttermilk, prepared from recipe and KELLOGG'S, EGGO, Wafflers, Strawberry Strudel .
Infographic
Mineral Comparison
Mineral comparison score is based on the number of minerals by which one or the other food is richer. The "coverage" charts below show how much of the daily needs can be covered by 300 grams of the food.
7
100 g
300 g
1 small (1-1/2" dia) - 14g 1 oz - 28.35g 1 biscuit (2-1/2" dia) - 60g 1 biscuit (4" dia) - 101g
Magnesium
Magnesium
Calcium
Calcium
Potassium
Potassium
Iron
Iron
Copper
Copper
Zinc
Zinc
Phosphorus
Phosphorus
Sodium
Sodium
Manganese
Manganese
Selenium
Selenium
13%
71%
11%
109%
27%
15%
70%
76%
49%
106%
3
100 g
300 g
2 waffles - 76g
Magnesium
Magnesium
Calcium
Calcium
Potassium
Potassium
Iron
Iron
Copper
Copper
Zinc
Zinc
Phosphorus
Phosphorus
Sodium
Sodium
Manganese
Manganese
Selenium
Selenium
9.3%
88%
6.3%
221%
0%
11%
113%
90%
0%
0%
Vitamin Comparison
Vitamin comparison score is based on the number of vitamins by which one or the other food is richer. The "coverage" charts below show how much of the daily needs can be covered by 300 grams of the food.
2
100 g
300 g
1 small (1-1/2" dia) - 14g 1 oz - 28.35g 1 biscuit (2-1/2" dia) - 60g 1 biscuit (4" dia) - 101g
Vitamin C
Vit. C
Vitamin D
Vit. D
Vitamin A
Vit. A
Vitamin E
Vit. E
Vitamin B1
Vit. B1
Vitamin B2
Vit. B2
Vitamin B3
Vit. B3
Vitamin B5
Vit. B5
Vitamin B6
Vit. B6
Vitamin B12
Vit. B12
Vitamin K
Vit. K
Folate
Folate
0.67%
0%
0%
0%
89%
72%
55%
17%
8.1%
10%
0%
46%
6
100 g
300 g
2 waffles - 76g
Vitamin C
Vit. C
Vitamin D
Vit. D
Vitamin A
Vit. A
Vitamin E
Vit. E
Vitamin B1
Vit. B1
Vitamin B2
Vit. B2
Vitamin B3
Vit. B3
Vitamin B5
Vit. B5
Vitamin B6
Vit. B6
Vitamin B12
Vit. B12
Vitamin K
Vit. K
Folate
Folate
0%
0%
132%
0%
98%
104%
99%
0%
122%
200%
0%
56%
All nutrients comparison - raw data values
Nutrient
DV% diff.
Vitamin B12
0.08µg
1.6µg
63%
Vitamin A
395µg
44%
Iron
2.9mg
5.9mg
38%
Vitamin B6
0.035mg
0.53mg
38%
Selenium
19.5µg
35%
Manganese
0.378mg
16%
Vitamin B3
2.949mg
5.3mg
15%
Phosphorus
164mg
263mg
14%
Vitamin B2
0.31mg
0.45mg
11%
Monounsaturated fat
6.93g
2.8g
10%
Copper
0.082mg
9%
Fats
16.3g
11g
8%
Saturated fat
4.324g
2.7g
7%
Calcium
235mg
293mg
6%
Vitamin B5
0.285mg
6%
Sodium
580mg
691mg
5%
Protein
7g
5g
4%
Cholesterol
3mg
12mg
3%
Vitamin B1
0.356mg
0.39mg
3%
Folate
61µg
74µg
3%
Polyunsaturated fat
4.163g
4.6g
3%
Calories
353kcal
318kcal
2%
Carbs
44.6g
50g
2%
Magnesium
18mg
13mg
1%
Potassium
121mg
71mg
1%
Fiber
1.5g
1.2g
1%
Zinc
0.54mg
0.4mg
1%
Protein per 100 calories
2g
1.6g
N/A
Calories per 10 g protein
504kcal
636kcal
N/A
Weight per 100 calories
28g
31g
N/A
Unsaturated / Saturated Fat ratio
2.6
2.7
N/A
Vitamin C
0.2mg
0%
Net carbs
43.1g
48.8g
N/A
Vitamin D*
1 IU
0%
Sugar
2.18g
16.8g
N/A
Trans fat
0.2g
N/A
Tryptophan
0.087mg
0%
Threonine
0.211mg
0%
Isoleucine
0.273mg
0%
Leucine
0.514mg
0%
Lysine
0.226mg
0%
Methionine
0.132mg
0%
Phenylalanine
0.347mg
0%
Valine
0.313mg
0%
Histidine
0.161mg
0%
Macronutrient Comparison
Macronutrient breakdown side-by-side comparison
2
7%
16%
45%
29%
3%
Protein:
7 g
Fats:
16.3 g
Carbs:
44.6 g
Water:
28.9 g
Other:
3.2 g
3
5%
11%
50%
29%
5%
Protein:
5 g
Fats:
11 g
Carbs:
50 g
Water:
29.2 g
Other:
4.8 g
Contains
more
Protein Protein
+40%
Contains
more
Fats Fats
+48.2%
Contains
more
Carbs Carbs
+12.1%
Contains
more
Other Other
+50%
Fat Type Comparison
Fat type breakdown side-by-side comparison
1
28%
45%
27%
Saturated fat:
Sat. Fat
4.324 g
Monounsaturated fat:
Mono. Fat
6.93 g
Polyunsaturated fat:
Poly. Fat
4.163 g
2
27%
28%
46%
Saturated fat:
Sat. Fat
2.7 g
Monounsaturated fat:
Mono. Fat
2.8 g
Polyunsaturated fat:
Poly. Fat
4.6 g
Contains
more
Mono. Fat Monounsaturated fat
+147.5%
Contains
less
Sat. Fat Saturated fat
-37.6%
Contains
more
Poly. Fat Polyunsaturated fat
+10.5%