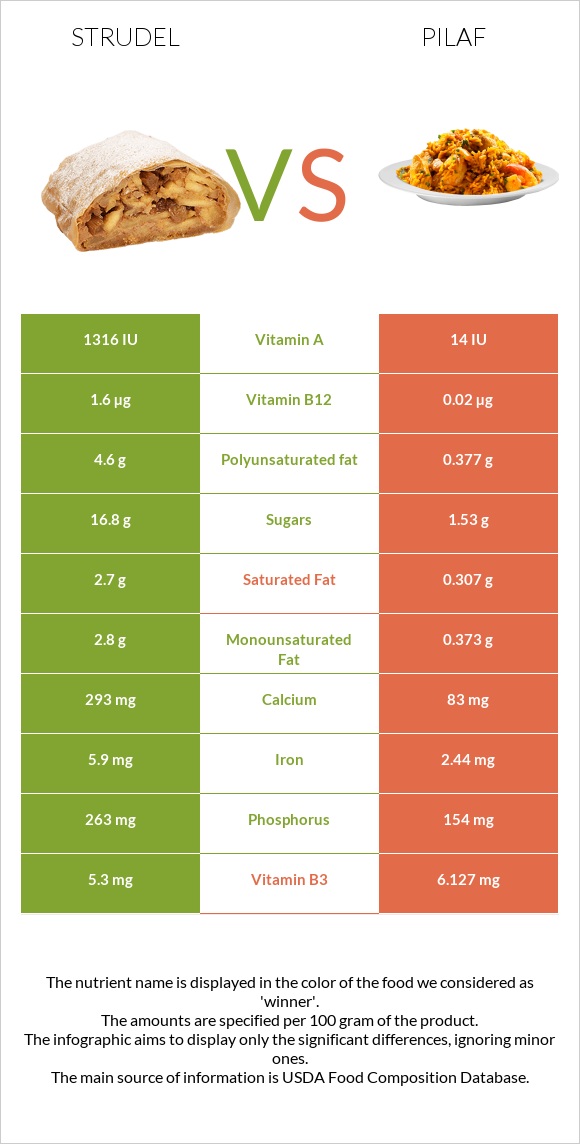
Significant differences between strudel and pilaf Strudel has more vitamin B12, iron, vitamin B2, vitamin A, calcium, and phosphorus; however, pilaf is richer in folate and vitamin B1. Strudel covers your daily vitamin B12 needs 66% more than pilaf. Pilaf has 94 times less vitamin A than strudel. Strudel has 1316 IU of vitamin A, while pilaf has 14 IU. Pilaf contains less saturated fat. Specific food types used in this comparison are KELLOGG'S, EGGO, Wafflers, Strawberry Strudel and Rice and vermicelli mix, rice pilaf flavor, unprepared .
Infographic
Mineral Comparison
Mineral comparison score is based on the number of minerals by which one or the other food is richer. The "coverage" charts below show how much of the daily needs can be covered by 300 grams of the food.
4
100 g
300 g
2 waffles - 76g
Magnesium
Magnesium
Calcium
Calcium
Potassium
Potassium
Iron
Iron
Copper
Copper
Zinc
Zinc
Phosphorus
Phosphorus
Sodium
Sodium
Manganese
Manganese
Selenium
Selenium
9.3%
88%
6.3%
221%
0%
11%
113%
90%
0%
0%
6
100 g
300 g
1 tbsp - 9.6g 0.333 cup - 68g
Magnesium
Magnesium
Calcium
Calcium
Potassium
Potassium
Iron
Iron
Copper
Copper
Zinc
Zinc
Phosphorus
Phosphorus
Sodium
Sodium
Manganese
Manganese
Selenium
Selenium
23%
25%
17%
92%
55%
28%
66%
170%
115%
177%
Vitamin Comparison
Vitamin comparison score is based on the number of vitamins by which one or the other food is richer. The "coverage" charts below show how much of the daily needs can be covered by 300 grams of the food.
4
100 g
300 g
2 waffles - 76g
Vitamin C
Vit. C
Vitamin D
Vit. D
Vitamin A
Vit. A
Vitamin E
Vit. E
Vitamin B1
Vit. B1
Vitamin B2
Vit. B2
Vitamin B3
Vit. B3
Vitamin B5
Vit. B5
Vitamin B6
Vit. B6
Vitamin B12
Vit. B12
Vitamin K
Vit. K
Folate
Folate
0%
0%
132%
0%
98%
104%
99%
0%
122%
200%
0%
56%
7
100 g
300 g
1 tbsp - 9.6g 0.333 cup - 68g
Vitamin C
Vit. C
Vitamin D
Vit. D
Vitamin A
Vit. A
Vitamin E
Vit. E
Vitamin B1
Vit. B1
Vitamin B2
Vit. B2
Vitamin B3
Vit. B3
Vitamin B5
Vit. B5
Vitamin B6
Vit. B6
Vitamin B12
Vit. B12
Vitamin K
Vit. K
Folate
Folate
14%
0%
1.3%
0.8%
151%
20%
115%
43%
92%
2.5%
1.3%
159%
All nutrients comparison - raw data values
Nutrient
DV% diff.
Vitamin B12
1.6µg
0.02µg
66%
Selenium
32.4µg
59%
Iron
5.9mg
2.44mg
43%
Vitamin A
395µg
4µg
43%
Manganese
0.882mg
38%
Folate
74µg
212µg
35%
Starch
71.23g
29%
Vitamin B2
0.45mg
0.087mg
28%
Polyunsaturated fat
4.6g
0.377g
28%
Sodium
691mg
1303mg
27%
Calcium
293mg
83mg
21%
Copper
0.166mg
18%
Vitamin B1
0.39mg
0.603mg
18%
Phosphorus
263mg
154mg
16%
Fats
11g
1.37g
15%
Vitamin B5
0.715mg
14%
Protein
5g
10.42g
11%
Saturated fat
2.7g
0.307g
11%
Vitamin B6
0.53mg
0.4mg
10%
Carbs
50g
76.31g
9%
Zinc
0.4mg
1.01mg
6%
Monounsaturated fat
2.8g
0.373g
6%
Vitamin C
4.1mg
5%
Magnesium
13mg
32mg
5%
Vitamin B3
5.3mg
6.127mg
5%
Cholesterol
12mg
1mg
4%
Potassium
71mg
188mg
3%
Choline
17.5mg
3%
Calories
318kcal
359kcal
2%
Protein per 100 calories
1.6g
2.9g
N/A
Calories per 10 g protein
636kcal
345kcal
N/A
Weight per 100 calories
31g
28g
N/A
Unsaturated / Saturated Fat ratio
2.7
2.4
N/A
Net carbs
48.8g
75.11g
N/A
Vitamin D*
1 IU
0 IU
0%
Sugar
16.8g
1.53g
N/A
Fiber
1.2g
1.2g
0%
Vitamin E
0mg
0.04mg
0%
Vitamin K
0.5µg
0%
Trans fat
0.2g
0g
N/A
Tryptophan
0.086mg
0%
Threonine
0.221mg
0%
Isoleucine
0.279mg
0%
Leucine
0.523mg
0%
Lysine
0.189mg
0%
Methionine
0.145mg
0%
Phenylalanine
0.32mg
0%
Valine
0.374mg
0%
Histidine
0.15mg
0%
Macronutrient Comparison
Macronutrient breakdown side-by-side comparison
3
5%
11%
50%
29%
5%
Protein:
5 g
Fats:
11 g
Carbs:
50 g
Water:
29.2 g
Other:
4.8 g
2
10%
76%
8%
4%
Protein:
10.42 g
Fats:
1.37 g
Carbs:
76.31 g
Water:
8.04 g
Other:
3.86 g
Contains
more
Fats Fats
+702.9%
Contains
more
Water Water
+263.2%
Contains
more
Other Other
+24.4%
Contains
more
Protein Protein
+108.4%
Contains
more
Carbs Carbs
+52.6%
Fat Type Comparison
Fat type breakdown side-by-side comparison
2
27%
28%
46%
Saturated fat:
Sat. Fat
2.7 g
Monounsaturated fat:
Mono. Fat
2.8 g
Polyunsaturated fat:
Poly. Fat
4.6 g
1
29%
35%
36%
Saturated fat:
Sat. Fat
0.307 g
Monounsaturated fat:
Mono. Fat
0.373 g
Polyunsaturated fat:
Poly. Fat
0.377 g
Contains
more
Mono. Fat Monounsaturated fat
+650.7%
Contains
more
Poly. Fat Polyunsaturated fat
+1120.2%
Contains
less
Sat. Fat Saturated fat
-88.6%