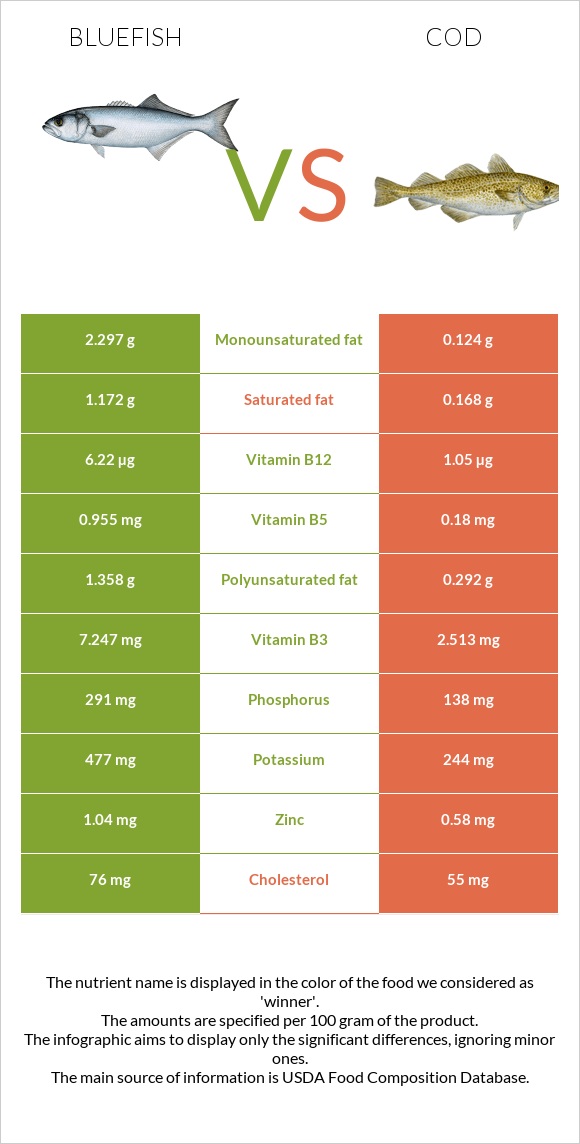
A recap on the differences between bluefish and cod Bluefish is higher than cod in vitamin B12, vitamin B3, phosphorus, selenium, vitamin B5, vitamin B6, vitamin A, and potassium. Bluefish covers your daily vitamin B12 needs 215% more than cod. Bluefish contains 10 times more vitamin A than cod. While bluefish contains 459 IU of vitamin A, cod contains only 47 IU. The amount of saturated fat in cod is lower. Food varieties used in this article are Fish, bluefish, cooked, dry heat and Fish, cod, Atlantic, cooked, dry heat .
Infographic
Mineral Comparison
Mineral comparison score is based on the number of minerals by which one or the other food is richer. The "coverage" charts below show how much of the daily needs can be covered by 300 grams of the food.
7
100 g
300 g
3 oz - 85g 1 fillet - 117g
Magnesium
Magnesium
Calcium
Calcium
Potassium
Potassium
Iron
Iron
Copper
Copper
Zinc
Zinc
Phosphorus
Phosphorus
Sodium
Sodium
Manganese
Manganese
Selenium
Selenium
30%
2.7%
42%
23%
23%
28%
125%
10%
3.5%
255%
1
100 g
300 g
3 oz - 85g 1 fillet - 180g
Magnesium
Magnesium
Calcium
Calcium
Potassium
Potassium
Iron
Iron
Copper
Copper
Zinc
Zinc
Phosphorus
Phosphorus
Sodium
Sodium
Manganese
Manganese
Selenium
Selenium
30%
4.2%
22%
18%
12%
16%
59%
10%
2.6%
205%
Vitamin Comparison
Vitamin comparison score is based on the number of vitamins by which one or the other food is richer. The "coverage" charts below show how much of the daily needs can be covered by 300 grams of the food.
6
100 g
300 g
3 oz - 85g 1 fillet - 117g
Vitamin C
Vit. C
Vitamin D
Vit. D
Vitamin A
Vit. A
Vitamin E
Vit. E
Vitamin B1
Vit. B1
Vitamin B2
Vit. B2
Vitamin B3
Vit. B3
Vitamin B5
Vit. B5
Vitamin B6
Vit. B6
Vitamin B12
Vit. B12
Vitamin K
Vit. K
Folate
Folate
0%
0%
46%
0%
17%
22%
136%
57%
107%
778%
0%
1.5%
6
100 g
300 g
3 oz - 85g 1 fillet - 180g
Vitamin C
Vit. C
Vitamin D
Vit. D
Vitamin A
Vit. A
Vitamin E
Vit. E
Vitamin B1
Vit. B1
Vitamin B2
Vit. B2
Vitamin B3
Vit. B3
Vitamin B5
Vit. B5
Vitamin B6
Vit. B6
Vitamin B12
Vit. B12
Vitamin K
Vit. K
Folate
Folate
3.3%
18%
4.7%
16%
22%
18%
47%
11%
65%
131%
0.25%
6%
All nutrients comparison - raw data values
Nutrient
DV% diff.
Vitamin B12
6.22µg
1.05µg
215%
Vitamin B3
7.247mg
2.513mg
30%
Phosphorus
291mg
138mg
22%
Selenium
46.8µg
37.6µg
17%
Vitamin B5
0.955mg
0.18mg
16%
Choline
83.7mg
15%
Vitamin A
138µg
14µg
14%
Vitamin B6
0.464mg
0.283mg
14%
Fats
5.44g
0.86g
7%
Cholesterol
76mg
55mg
7%
Potassium
477mg
244mg
7%
Polyunsaturated fat
1.358g
0.292g
7%
Protein
25.69g
22.83g
6%
Vitamin D*
46 IU
6%
Vitamin D
1.2µg
6%
Vitamin E
0.81mg
5%
Saturated fat
1.172g
0.168g
5%
Monounsaturated fat
2.297g
0.124g
5%
Copper
0.068mg
0.036mg
4%
Zinc
1.04mg
0.58mg
4%
Calories
159kcal
105kcal
3%
Iron
0.62mg
0.49mg
2%
Vitamin B1
0.067mg
0.088mg
2%
Folate
2µg
8µg
2%
Vitamin C
0mg
1mg
1%
Calcium
9mg
14mg
1%
Vitamin B2
0.097mg
0.079mg
1%
Protein per 100 calories
16g
22g
N/A
Calories per 10 g protein
62kcal
46kcal
N/A
Weight per 100 calories
63g
95g
N/A
Unsaturated / Saturated Fat ratio
3.1
2.5
N/A
Magnesium
42mg
42mg
0%
Sodium
77mg
78mg
0%
Manganese
0.027mg
0.02mg
0%
Vitamin K
0.1µg
0%
Tryptophan
0.288mg
0.256mg
0%
Threonine
1.126mg
1.001mg
0%
Isoleucine
1.184mg
1.052mg
0%
Leucine
2.088mg
1.856mg
0%
Lysine
2.36mg
2.097mg
0%
Methionine
0.76mg
0.676mg
0%
Phenylalanine
1.003mg
0.891mg
0%
Valine
1.324mg
1.176mg
0%
Histidine
0.756mg
0.672mg
0%
Omega-3 - EPA
0.323g
0.004g
N/A
Omega-3 - DHA
0.665g
0.154g
N/A
Omega-3 - DPA
0.079g
0.013g
N/A
Macronutrient Comparison
Macronutrient breakdown side-by-side comparison
3
26%
5%
63%
6%
Protein:
25.69 g
Fats:
5.44 g
Carbs:
0 g
Water:
62.64 g
Other:
6.23 g
1
23%
76%
Protein:
22.83 g
Fats:
0.86 g
Carbs:
0 g
Water:
75.92 g
Other:
0.39 g
Contains
more
Protein Protein
+12.5%
Contains
more
Fats Fats
+532.6%
Contains
more
Other Other
+1497.4%
Contains
more
Water Water
+21.2%
Fat Type Comparison
Fat type breakdown side-by-side comparison
2
24%
48%
28%
Saturated fat:
Sat. Fat
1.172 g
Monounsaturated fat:
Mono. Fat
2.297 g
Polyunsaturated fat:
Poly. Fat
1.358 g
1
29%
21%
50%
Saturated fat:
Sat. Fat
0.168 g
Monounsaturated fat:
Mono. Fat
0.124 g
Polyunsaturated fat:
Poly. Fat
0.292 g
Contains
more
Mono. Fat Monounsaturated fat
+1752.4%
Contains
more
Poly. Fat Polyunsaturated fat
+365.1%
Contains
less
Sat. Fat Saturated fat
-85.7%