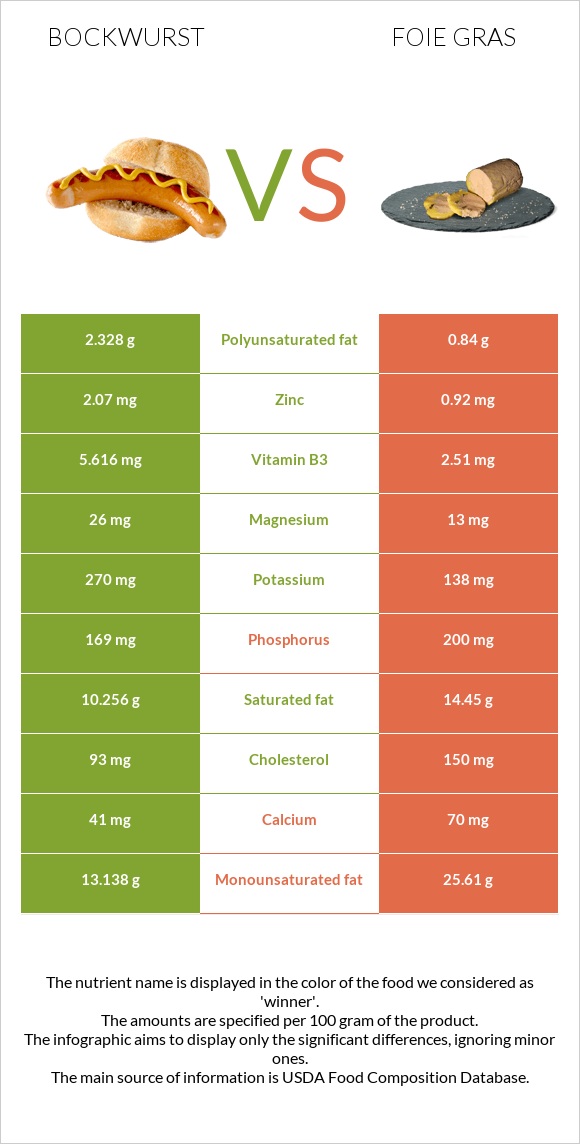
How are bockwurst and foie gras different? Bockwurst is richer in vitamin B6 and vitamin B3, while foie gras is higher in vitamin B12, vitamin A, selenium, iron, copper, and folate. Foie gras covers your daily need for vitamin B12, 356% more than bockwurst. Bockwurst contains 6 times more vitamin B6 than foie gras. Bockwurst contains 0.378mg of vitamin B6, while foie gras contains 0.06mg. Bockwurst is lower in saturated fat. Bockwurst, pork, veal, raw and Pate de foie gras, canned (goose liver pate), smoked types were used in this article.
Infographic
Mineral Comparison
Mineral comparison score is based on the number of minerals by which one or the other food is richer. The "coverage" charts below show how much of the daily needs can be covered by 300 grams of the food.
4
100 g
300 g
1 sausage - 91g
Magnesium
Magnesium
Calcium
Calcium
Potassium
Potassium
Iron
Iron
Copper
Copper
Zinc
Zinc
Phosphorus
Phosphorus
Sodium
Sodium
Manganese
Manganese
Selenium
Selenium
19%
12%
24%
43%
33%
56%
72%
99%
22%
62%
5
100 g
300 g
1 tbsp - 13g 1 oz - 28.35g
Magnesium
Magnesium
Calcium
Calcium
Potassium
Potassium
Iron
Iron
Copper
Copper
Zinc
Zinc
Phosphorus
Phosphorus
Sodium
Sodium
Manganese
Manganese
Selenium
Selenium
9.3%
21%
12%
206%
133%
25%
86%
91%
16%
240%
Vitamin Comparison
Vitamin comparison score is based on the number of vitamins by which one or the other food is richer. The "coverage" charts below show how much of the daily needs can be covered by 300 grams of the food.
6
100 g
300 g
1 sausage - 91g
Vitamin C
Vit. C
Vitamin D
Vit. D
Vitamin A
Vit. A
Vitamin E
Vit. E
Vitamin B1
Vit. B1
Vitamin B2
Vit. B2
Vitamin B3
Vit. B3
Vitamin B5
Vit. B5
Vitamin B6
Vit. B6
Vitamin B12
Vit. B12
Vitamin K
Vit. K
Folate
Folate
11%
0%
5%
7.6%
48%
54%
105%
53%
87%
108%
176%
13%
5
100 g
300 g
1 tbsp - 13g 1 oz - 28.35g
Vitamin C
Vit. C
Vitamin D
Vit. D
Vitamin A
Vit. A
Vitamin E
Vit. E
Vitamin B1
Vit. B1
Vitamin B2
Vit. B2
Vitamin B3
Vit. B3
Vitamin B5
Vit. B5
Vitamin B6
Vit. B6
Vitamin B12
Vit. B12
Vitamin K
Vit. K
Folate
Folate
6.7%
0%
334%
0%
22%
69%
47%
72%
14%
1175%
0%
45%
All nutrients comparison - raw data values
Nutrient
DV% diff.
Vitamin B12
0.86µg
9.4µg
356%
Vitamin A
15µg
1001µg
110%
Selenium
11.3µg
44µg
59%
Vitamin K
70.2µg
59%
Tryptophan
153mg
0.161mg
55%
Iron
1.15mg
5.5mg
54%
Copper
0.1mg
0.4mg
33%
Monounsaturated fat
13.138g
25.61g
31%
Fats
25.87g
43.84g
28%
Vitamin B6
0.378mg
0.06mg
24%
Cholesterol
93mg
150mg
19%
Vitamin B3
5.616mg
2.51mg
19%
Saturated fat
10.256g
14.45g
19%
Folate
17µg
60µg
11%
Zinc
2.07mg
0.92mg
10%
Polyunsaturated fat
2.328g
0.84g
10%
Vitamin B1
0.193mg
0.088mg
9%
Calories
301kcal
462kcal
8%
Choline
46.4mg
8%
Vitamin B5
0.891mg
1.2mg
6%
Protein
14.03g
11.4g
5%
Vitamin B2
0.233mg
0.299mg
5%
Potassium
270mg
138mg
4%
Fiber
1g
0g
4%
Phosphorus
169mg
200mg
4%
Magnesium
26mg
13mg
3%
Calcium
41mg
70mg
3%
Sodium
756mg
697mg
3%
Vitamin E
0.38mg
3%
Manganese
0.171mg
0.12mg
2%
Vitamin C
3.2mg
2mg
1%
Carbs
2.95g
4.67g
1%
Protein per 100 calories
4.7g
2.5g
N/A
Calories per 10 g protein
215kcal
405kcal
N/A
Weight per 100 calories
33g
22g
N/A
Unsaturated / Saturated Fat ratio
1.5
1.8
N/A
Net carbs
1.95g
4.67g
N/A
Sugar
1.33g
N/A
Threonine
0.613mg
0.507mg
0%
Isoleucine
0.677mg
0.606mg
0%
Leucine
1.107mg
1.029mg
0%
Lysine
1.166mg
0.863mg
0%
Methionine
0.333mg
0.27mg
0%
Phenylalanine
0.556mg
0.567mg
0%
Valine
0.767mg
0.719mg
0%
Histidine
0.513mg
0.303mg
0%
Fructose
0.01g
0%
Macronutrient Comparison
Macronutrient breakdown side-by-side comparison
2
14%
26%
3%
54%
3%
Protein:
14.03 g
Fats:
25.87 g
Carbs:
2.95 g
Water:
54.47 g
Other:
2.68 g
3
11%
44%
5%
37%
3%
Protein:
11.4 g
Fats:
43.84 g
Carbs:
4.67 g
Water:
37.04 g
Other:
3.05 g
Contains
more
Protein Protein
+23.1%
Contains
more
Water Water
+47.1%
Contains
more
Fats Fats
+69.5%
Contains
more
Carbs Carbs
+58.3%
Contains
more
Other Other
+13.8%
Fat Type Comparison
Fat type breakdown side-by-side comparison
2
40%
51%
9%
Saturated fat:
Sat. Fat
10.256 g
Monounsaturated fat:
Mono. Fat
13.138 g
Polyunsaturated fat:
Poly. Fat
2.328 g
1
35%
63%
2%
Saturated fat:
Sat. Fat
14.45 g
Monounsaturated fat:
Mono. Fat
25.61 g
Polyunsaturated fat:
Poly. Fat
0.84 g
Contains
less
Sat. Fat Saturated fat
-29%
Contains
more
Poly. Fat Polyunsaturated fat
+177.1%
Contains
more
Mono. Fat Monounsaturated fat
+94.9%