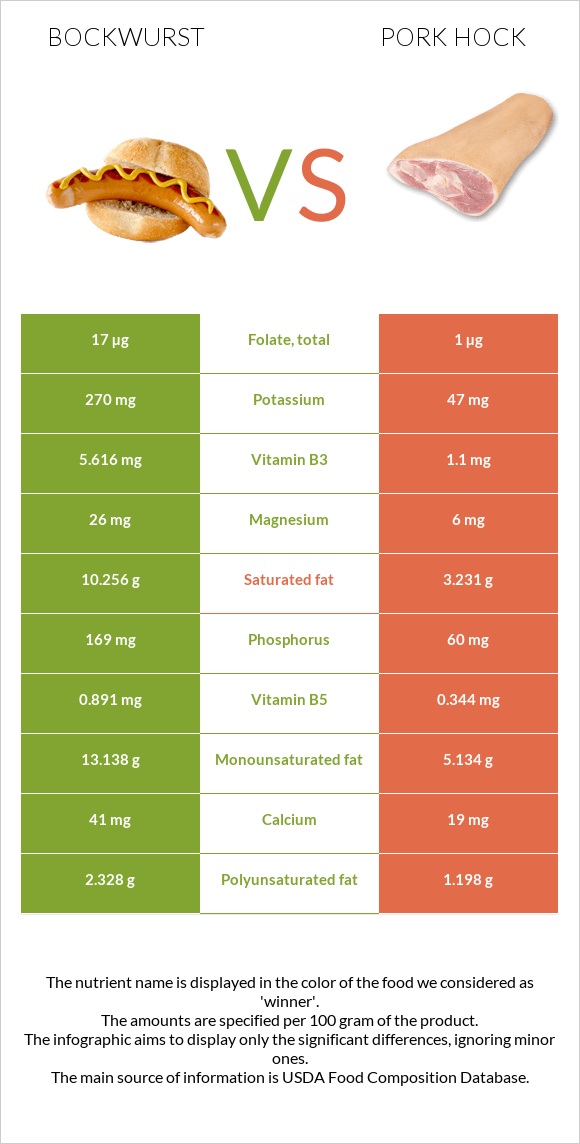
The main differences between bockwurst and pork hock Bockwurst is richer in vitamin K, vitamin B3, vitamin B6, phosphorus, vitamin B12, vitamin B2, and vitamin B5, yet pork hock is richer in selenium. Daily need coverage for vitamin K for bockwurst is 59% higher. Bockwurst contains 6 times more vitamin B6 than pork hock. Bockwurst contains 0.378mg of vitamin B6, while pork hock contains 0.064mg. Pork hock contains less saturated fat. Pork hock has a lower glycemic index than bockwurst. Food types used in this article are Bockwurst, pork, veal, raw and Pork, pickled pork hocks .
Infographic
Mineral Comparison
Mineral comparison score is based on the number of minerals by which one or the other food is richer. The "coverage" charts below show how much of the daily needs can be covered by 300 grams of the food.
7
100 g
300 g
1 sausage - 91g
Magnesium
Magnesium
Calcium
Calcium
Potassium
Potassium
Iron
Iron
Copper
Copper
Zinc
Zinc
Phosphorus
Phosphorus
Sodium
Sodium
Manganese
Manganese
Selenium
Selenium
19%
12%
24%
43%
33%
56%
72%
99%
22%
62%
2
100 g
300 g
3 oz - 117g
Magnesium
Magnesium
Calcium
Calcium
Potassium
Potassium
Iron
Iron
Copper
Copper
Zinc
Zinc
Phosphorus
Phosphorus
Sodium
Sodium
Manganese
Manganese
Selenium
Selenium
4.3%
5.7%
4.1%
43%
27%
65%
26%
137%
2.9%
143%
Vitamin Comparison
Vitamin comparison score is based on the number of vitamins by which one or the other food is richer. The "coverage" charts below show how much of the daily needs can be covered by 300 grams of the food.
10
100 g
300 g
1 sausage - 91g
Vitamin C
Vit. C
Vitamin D
Vit. D
Vitamin A
Vit. A
Vitamin E
Vit. E
Vitamin B1
Vit. B1
Vitamin B2
Vit. B2
Vitamin B3
Vit. B3
Vitamin B5
Vit. B5
Vitamin B6
Vit. B6
Vitamin B12
Vit. B12
Vitamin K
Vit. K
Folate
Folate
11%
0%
5%
7.6%
48%
54%
105%
53%
87%
108%
176%
13%
1
100 g
300 g
3 oz - 117g
Vitamin C
Vit. C
Vitamin D
Vit. D
Vitamin A
Vit. A
Vitamin E
Vit. E
Vitamin B1
Vit. B1
Vitamin B2
Vit. B2
Vitamin B3
Vit. B3
Vitamin B5
Vit. B5
Vitamin B6
Vit. B6
Vitamin B12
Vit. B12
Vitamin K
Vit. K
Folate
Folate
0%
0%
7.7%
3.4%
20%
16%
21%
21%
15%
64%
0%
0.75%
All nutrients comparison - raw data values
Nutrient
DV% diff.
Vitamin K
70.2µg
0µg
59%
Tryptophan
153mg
0.038mg
55%
Saturated fat
10.256g
3.231g
32%
Vitamin B3
5.616mg
1.1mg
28%
Selenium
11.3µg
26.3µg
27%
Fats
25.87g
10.54g
24%
Vitamin B6
0.378mg
0.064mg
24%
Monounsaturated fat
13.138g
5.134g
20%
Phosphorus
169mg
60mg
16%
Vitamin B12
0.86µg
0.51µg
15%
Sodium
756mg
1050mg
13%
Vitamin B2
0.233mg
0.068mg
13%
Vitamin B5
0.891mg
0.344mg
11%
Protein
14.03g
19.11g
10%
Vitamin B1
0.193mg
0.08mg
9%
Choline
46.4mg
8%
Polyunsaturated fat
2.328g
1.198g
8%
Calories
301kcal
171kcal
7%
Potassium
270mg
47mg
7%
Manganese
0.171mg
0.022mg
6%
Magnesium
26mg
6mg
5%
Vitamin C
3.2mg
0mg
4%
Fiber
1g
0g
4%
Folate
17µg
1µg
4%
Zinc
2.07mg
2.38mg
3%
Calcium
41mg
19mg
2%
Copper
0.1mg
0.082mg
2%
Carbs
2.95g
0g
1%
Cholesterol
93mg
89mg
1%
Vitamin A
15µg
23µg
1%
Vitamin E
0.38mg
0.17mg
1%
Protein per 100 calories
4.7g
11g
N/A
Calories per 10 g protein
215kcal
89kcal
N/A
Weight per 100 calories
33g
58g
N/A
Unsaturated / Saturated Fat ratio
1.5
2
N/A
Net carbs
1.95g
0g
N/A
Iron
1.15mg
1.14mg
0%
Sugar
1.33g
0g
N/A
Trans fat
0.113g
N/A
Threonine
0.613mg
0.516mg
0%
Isoleucine
0.677mg
0.325mg
0%
Leucine
1.107mg
0.841mg
0%
Lysine
1.166mg
0.822mg
0%
Methionine
0.333mg
0.211mg
0%
Phenylalanine
0.556mg
0.554mg
0%
Valine
0.767mg
0.478mg
0%
Histidine
0.513mg
0.211mg
0%
Fructose
0.01g
0g
0%
Omega-3 - ALA
0.042g
N/A
Omega-6 - Eicosadienoic acid
0.045g
N/A
Omega-6 - Linoleic acid
0.986g
N/A
Macronutrient Comparison
Macronutrient breakdown side-by-side comparison
3
14%
26%
3%
54%
3%
Protein:
14.03 g
Fats:
25.87 g
Carbs:
2.95 g
Water:
54.47 g
Other:
2.68 g
2
19%
11%
68%
2%
Protein:
19.11 g
Fats:
10.54 g
Carbs:
0 g
Water:
68.02 g
Other:
2.33 g
Contains
more
Fats Fats
+145.4%
Contains
more
Carbs Carbs
+∞%
Contains
more
Other Other
+15%
Contains
more
Protein Protein
+36.2%
Contains
more
Water Water
+24.9%
Fat Type Comparison
Fat type breakdown side-by-side comparison
2
40%
51%
9%
Saturated fat:
Sat. Fat
10.256 g
Monounsaturated fat:
Mono. Fat
13.138 g
Polyunsaturated fat:
Poly. Fat
2.328 g
1
34%
54%
13%
Saturated fat:
Sat. Fat
3.231 g
Monounsaturated fat:
Mono. Fat
5.134 g
Polyunsaturated fat:
Poly. Fat
1.198 g
Contains
more
Mono. Fat Monounsaturated fat
+155.9%
Contains
more
Poly. Fat Polyunsaturated fat
+94.3%
Contains
less
Sat. Fat Saturated fat
-68.5%