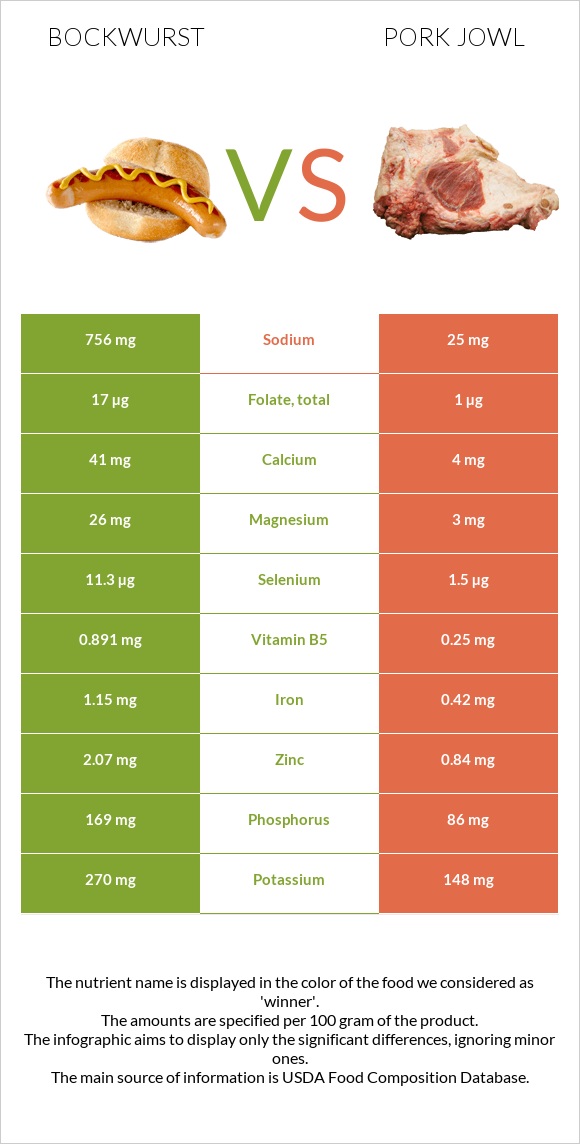
Differences between bockwurst and pork jowl Bockwurst has more vitamin B6, selenium, vitamin B5, phosphorus, zinc, iron, and manganese, while pork jowl has more vitamin B1. Pork jowl's daily need coverage for saturated fat is 75% higher. Pork jowl contains 34 times less manganese than bockwurst. Bockwurst contains 0.171mg of manganese, while pork jowl contains 0.005mg. The amount of sodium in pork jowl is lower. Pork jowl has a lower glycemic index. The glycemic index of pork jowl is 0, while the glycemic index of bockwurst is 28. The food types used in this comparison are Bockwurst, pork, veal, raw and Pork, fresh, variety meats, and by-products, jowl, raw .
Infographic
Mineral Comparison
Mineral comparison score is based on the number of minerals by which one or the other food is richer. The "coverage" charts below show how much of the daily needs can be covered by 300 grams of the food.
9
100 g
300 g
1 sausage - 91g
Magnesium
Magnesium
Calcium
Calcium
Potassium
Potassium
Iron
Iron
Copper
Copper
Zinc
Zinc
Phosphorus
Phosphorus
Sodium
Sodium
Manganese
Manganese
Selenium
Selenium
19%
12%
24%
43%
33%
56%
72%
99%
22%
62%
1
100 g
300 g
1 oz - 28.35g 4 oz - 113g
Magnesium
Magnesium
Calcium
Calcium
Potassium
Potassium
Iron
Iron
Copper
Copper
Zinc
Zinc
Phosphorus
Phosphorus
Sodium
Sodium
Manganese
Manganese
Selenium
Selenium
2.1%
1.2%
13%
16%
13%
23%
37%
3.3%
0.65%
8.2%
Vitamin Comparison
Vitamin comparison score is based on the number of vitamins by which one or the other food is richer. The "coverage" charts below show how much of the daily needs can be covered by 300 grams of the food.
8
100 g
300 g
1 sausage - 91g
Vitamin C
Vit. C
Vitamin D
Vit. D
Vitamin A
Vit. A
Vitamin E
Vit. E
Vitamin B1
Vit. B1
Vitamin B2
Vit. B2
Vitamin B3
Vit. B3
Vitamin B5
Vit. B5
Vitamin B6
Vit. B6
Vitamin B12
Vit. B12
Vitamin K
Vit. K
Folate
Folate
11%
0%
5%
7.6%
48%
54%
105%
53%
87%
108%
176%
13%
1
100 g
300 g
1 oz - 28.35g 4 oz - 113g
Vitamin C
Vit. C
Vitamin D
Vit. D
Vitamin A
Vit. A
Vitamin E
Vit. E
Vitamin B1
Vit. B1
Vitamin B2
Vit. B2
Vitamin B3
Vit. B3
Vitamin B5
Vit. B5
Vitamin B6
Vit. B6
Vitamin B12
Vit. B12
Vitamin K
Vit. K
Folate
Folate
0%
0%
1%
5.8%
97%
54%
85%
15%
21%
103%
0%
0.75%
All nutrients comparison - raw data values
Nutrient
DV% diff.
Saturated fat
10.256g
25.26g
68%
Fats
25.87g
69.61g
67%
Vitamin K
70.2µg
59%
Tryptophan
153mg
0.021mg
55%
Monounsaturated fat
13.138g
32.89g
49%
Polyunsaturated fat
2.328g
8.11g
39%
Sodium
756mg
25mg
32%
Vitamin B6
0.378mg
0.09mg
22%
Calories
301kcal
655kcal
18%
Selenium
11.3µg
1.5µg
18%
Vitamin B1
0.193mg
0.386mg
16%
Protein
14.03g
6.38g
15%
Vitamin B5
0.891mg
0.25mg
13%
Phosphorus
169mg
86mg
12%
Zinc
2.07mg
0.84mg
11%
Iron
1.15mg
0.42mg
9%
Choline
46.4mg
8%
Copper
0.1mg
0.04mg
7%
Manganese
0.171mg
0.005mg
7%
Vitamin B3
5.616mg
4.535mg
7%
Magnesium
26mg
3mg
5%
Vitamin C
3.2mg
0mg
4%
Calcium
41mg
4mg
4%
Potassium
270mg
148mg
4%
Fiber
1g
0g
4%
Folate
17µg
1µg
4%
Vitamin B12
0.86µg
0.82µg
2%
Carbs
2.95g
0g
1%
Cholesterol
93mg
90mg
1%
Vitamin A
15µg
3µg
1%
Vitamin E
0.38mg
0.29mg
1%
Protein per 100 calories
4.7g
0.97g
N/A
Calories per 10 g protein
215kcal
1027kcal
N/A
Weight per 100 calories
33g
15g
N/A
Unsaturated / Saturated Fat ratio
1.5
1.6
N/A
Net carbs
1.95g
0g
N/A
Sugar
1.33g
0g
N/A
Vitamin B2
0.233mg
0.236mg
0%
Threonine
0.613mg
0.21mg
0%
Isoleucine
0.677mg
0.168mg
0%
Leucine
1.107mg
0.446mg
0%
Lysine
1.166mg
0.528mg
0%
Methionine
0.333mg
0.095mg
0%
Phenylalanine
0.556mg
0.239mg
0%
Valine
0.767mg
0.305mg
0%
Histidine
0.513mg
0.072mg
0%
Fructose
0.01g
0%
Macronutrient Comparison
Macronutrient breakdown side-by-side comparison
4
14%
26%
3%
54%
3%
Protein:
14.03 g
Fats:
25.87 g
Carbs:
2.95 g
Water:
54.47 g
Other:
2.68 g
1
6%
70%
22%
2%
Protein:
6.38 g
Fats:
69.61 g
Carbs:
0 g
Water:
22.19 g
Other:
1.82 g
Contains
more
Protein Protein
+119.9%
Contains
more
Carbs Carbs
+∞%
Contains
more
Water Water
+145.5%
Contains
more
Other Other
+47.3%
Contains
more
Fats Fats
+169.1%
Fat Type Comparison
Fat type breakdown side-by-side comparison
1
40%
51%
9%
Saturated fat:
Sat. Fat
10.256 g
Monounsaturated fat:
Mono. Fat
13.138 g
Polyunsaturated fat:
Poly. Fat
2.328 g
2
38%
50%
12%
Saturated fat:
Sat. Fat
25.26 g
Monounsaturated fat:
Mono. Fat
32.89 g
Polyunsaturated fat:
Poly. Fat
8.11 g
Contains
less
Sat. Fat Saturated fat
-59.4%
Contains
more
Mono. Fat Monounsaturated fat
+150.3%
Contains
more
Poly. Fat Polyunsaturated fat
+248.4%