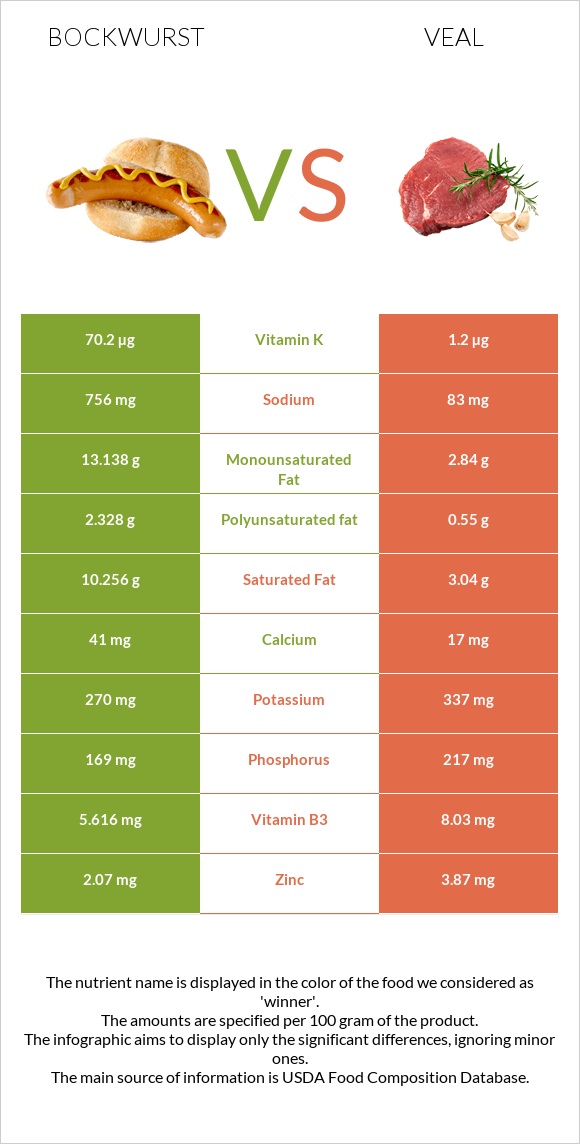
How are bockwurst and veal different? Bockwurst is higher in vitamin K, vitamin B1, and manganese; however, veal is richer in vitamin B12, zinc, vitamin B3, choline, and phosphorus. Daily need coverage for vitamin K for bockwurst is 58% higher. Bockwurst contains 9 times more sodium than veal. While bockwurst contains 756mg of sodium, veal contains only 83mg. Veal has a lower glycemic index (0) than bockwurst (28). Bockwurst, pork, veal, raw and Veal, ground, cooked, broiled are the varieties used in this article.
Infographic
Mineral Comparison
Mineral comparison score is based on the number of minerals by which one or the other food is richer. The "coverage" charts below show how much of the daily needs can be covered by 300 grams of the food.
3
100 g
300 g
1 sausage - 91g
Magnesium
Magnesium
Calcium
Calcium
Potassium
Potassium
Iron
Iron
Copper
Copper
Zinc
Zinc
Phosphorus
Phosphorus
Sodium
Sodium
Manganese
Manganese
Selenium
Selenium
19%
12%
24%
43%
33%
56%
72%
99%
22%
62%
5
100 g
300 g
3 oz - 85g 1 unit, cooked (yield from 1 lb raw meat) - 299g
Magnesium
Magnesium
Calcium
Calcium
Potassium
Potassium
Iron
Iron
Copper
Copper
Zinc
Zinc
Phosphorus
Phosphorus
Sodium
Sodium
Manganese
Manganese
Selenium
Selenium
17%
5.1%
30%
37%
34%
106%
93%
11%
4.6%
75%
Vitamin Comparison
Vitamin comparison score is based on the number of vitamins by which one or the other food is richer. The "coverage" charts below show how much of the daily needs can be covered by 300 grams of the food.
6
100 g
300 g
1 sausage - 91g
Vitamin C
Vit. C
Vitamin D
Vit. D
Vitamin A
Vit. A
Vitamin E
Vit. E
Vitamin B1
Vit. B1
Vitamin B2
Vit. B2
Vitamin B3
Vit. B3
Vitamin B5
Vit. B5
Vitamin B6
Vit. B6
Vitamin B12
Vit. B12
Vitamin K
Vit. K
Folate
Folate
11%
0%
5%
7.6%
48%
54%
105%
53%
87%
108%
176%
13%
4
100 g
300 g
3 oz - 85g 1 unit, cooked (yield from 1 lb raw meat) - 299g
Vitamin C
Vit. C
Vitamin D
Vit. D
Vitamin A
Vit. A
Vitamin E
Vit. E
Vitamin B1
Vit. B1
Vitamin B2
Vit. B2
Vitamin B3
Vit. B3
Vitamin B5
Vit. B5
Vitamin B6
Vit. B6
Vitamin B12
Vit. B12
Vitamin K
Vit. K
Folate
Folate
0%
0%
0%
3%
18%
62%
151%
70%
90%
159%
3%
8.3%
All nutrients comparison - raw data values
Nutrient
DV% diff.
Vitamin K
70.2µg
1.2µg
58%
Tryptophan
153mg
0.247mg
55%
Saturated fat
10.256g
3.04g
33%
Sodium
756mg
83mg
29%
Fats
25.87g
7.56g
28%
Monounsaturated fat
13.138g
2.84g
26%
Protein
14.03g
24.38g
21%
Vitamin B12
0.86µg
1.27µg
17%
Zinc
2.07mg
3.87mg
16%
Vitamin B3
5.616mg
8.03mg
15%
Polyunsaturated fat
2.328g
0.55g
12%
Vitamin B1
0.193mg
0.07mg
10%
Choline
46.4mg
95mg
9%
Phosphorus
169mg
217mg
7%
Calories
301kcal
172kcal
6%
Manganese
0.171mg
0.035mg
6%
Vitamin B5
0.891mg
1.16mg
5%
Vitamin C
3.2mg
0mg
4%
Fiber
1g
0g
4%
Selenium
11.3µg
13.7µg
4%
Cholesterol
93mg
103mg
3%
Vitamin B2
0.233mg
0.27mg
3%
Calcium
41mg
17mg
2%
Potassium
270mg
337mg
2%
Iron
1.15mg
0.99mg
2%
Vitamin A
15µg
0µg
2%
Vitamin E
0.38mg
0.15mg
2%
Folate
17µg
11µg
2%
Carbs
2.95g
0g
1%
Vitamin B6
0.378mg
0.39mg
1%
Protein per 100 calories
4.7g
14g
N/A
Calories per 10 g protein
215kcal
71kcal
N/A
Weight per 100 calories
33g
58g
N/A
Unsaturated / Saturated Fat ratio
1.5
1.1
N/A
Net carbs
1.95g
0g
N/A
Magnesium
26mg
24mg
0%
Sugar
1.33g
0g
N/A
Copper
0.1mg
0.103mg
0%
Threonine
0.613mg
1.065mg
0%
Isoleucine
0.677mg
1.201mg
0%
Leucine
1.107mg
1.94mg
0%
Lysine
1.166mg
2.009mg
0%
Methionine
0.333mg
0.569mg
0%
Phenylalanine
0.556mg
0.984mg
0%
Valine
0.767mg
1.347mg
0%
Histidine
0.513mg
0.885mg
0%
Fructose
0.01g
0%
Macronutrient Comparison
Macronutrient breakdown side-by-side comparison
3
14%
26%
3%
54%
3%
Protein:
14.03 g
Fats:
25.87 g
Carbs:
2.95 g
Water:
54.47 g
Other:
2.68 g
2
24%
8%
67%
Protein:
24.38 g
Fats:
7.56 g
Carbs:
0 g
Water:
66.76 g
Other:
1.3 g
Contains
more
Fats Fats
+242.2%
Contains
more
Carbs Carbs
+∞%
Contains
more
Other Other
+106.2%
Contains
more
Protein Protein
+73.8%
Contains
more
Water Water
+22.6%
Fat Type Comparison
Fat type breakdown side-by-side comparison
2
40%
51%
9%
Saturated fat:
Sat. Fat
10.256 g
Monounsaturated fat:
Mono. Fat
13.138 g
Polyunsaturated fat:
Poly. Fat
2.328 g
1
47%
44%
9%
Saturated fat:
Sat. Fat
3.04 g
Monounsaturated fat:
Mono. Fat
2.84 g
Polyunsaturated fat:
Poly. Fat
0.55 g
Contains
more
Mono. Fat Monounsaturated fat
+362.6%
Contains
more
Poly. Fat Polyunsaturated fat
+323.3%
Contains
less
Sat. Fat Saturated fat
-70.4%