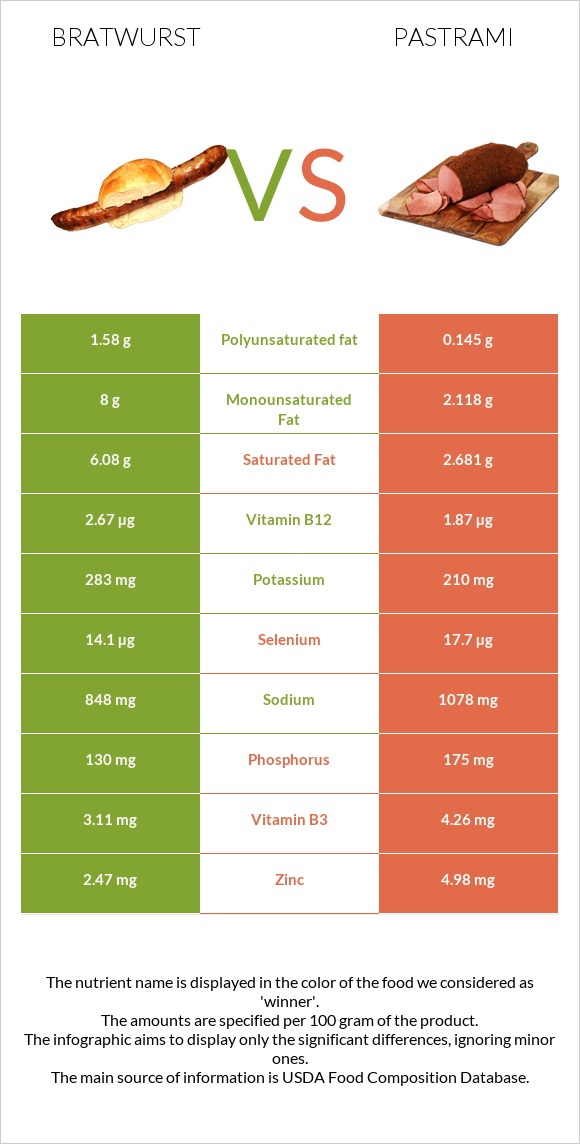
What are the differences between bratwurst and pastrami? Bratwurst is higher in vitamin B12, vitamin B1, and vitamin B5, yet pastrami is higher in zinc, iron, vitamin B3, selenium, and phosphorus. Bratwurst's daily need coverage for vitamin B12 is 33% more. Bratwurst has 7 times more vitamin B1 than pastrami. While bratwurst has 0.38mg of vitamin B1, pastrami has only 0.052mg. The amount of saturated fat in pastrami is lower. The glycemic index of bratwurst is lower. We used Bratwurst, beef, and pork, smoked and Beef, cured, pastrami types in this article.
Infographic
Mineral Comparison
Mineral comparison score is based on the number of minerals by which one or the other food is richer. The "coverage" charts below show how much of the daily needs can be covered by 300 grams of the food.
3
100 g
300 g
1 serving 2.33 oz - 66g
Magnesium
Magnesium
Calcium
Calcium
Potassium
Potassium
Iron
Iron
Copper
Copper
Zinc
Zinc
Phosphorus
Phosphorus
Sodium
Sodium
Manganese
Manganese
Selenium
Selenium
11%
2.1%
25%
38%
27%
67%
56%
111%
5.3%
77%
7
100 g
300 g
1 slice (1 oz) - 28g 1 package, 2.5 oz - 71g
Magnesium
Magnesium
Calcium
Calcium
Potassium
Potassium
Iron
Iron
Copper
Copper
Zinc
Zinc
Phosphorus
Phosphorus
Sodium
Sodium
Manganese
Manganese
Selenium
Selenium
12%
3%
19%
83%
30%
136%
75%
141%
3.5%
97%
Vitamin Comparison
Vitamin comparison score is based on the number of vitamins by which one or the other food is richer. The "coverage" charts below show how much of the daily needs can be covered by 300 grams of the food.
4
100 g
300 g
1 serving 2.33 oz - 66g
Vitamin C
Vit. C
Vitamin D
Vit. D
Vitamin A
Vit. A
Vitamin E
Vit. E
Vitamin B1
Vit. B1
Vitamin B2
Vit. B2
Vitamin B3
Vit. B3
Vitamin B5
Vit. B5
Vitamin B6
Vit. B6
Vitamin B12
Vit. B12
Vitamin K
Vit. K
Folate
Folate
0%
0%
0%
0%
95%
49%
58%
41%
46%
334%
0%
3%
8
100 g
300 g
1 slice (1 oz) - 28g 1 package, 2.5 oz - 71g
Vitamin C
Vit. C
Vitamin D
Vit. D
Vitamin A
Vit. A
Vitamin E
Vit. E
Vitamin B1
Vit. B1
Vitamin B2
Vit. B2
Vitamin B3
Vit. B3
Vitamin B5
Vit. B5
Vitamin B6
Vit. B6
Vitamin B12
Vit. B12
Vitamin K
Vit. K
Folate
Folate
1%
1.5%
0.67%
2.4%
13%
37%
80%
16%
51%
234%
1.8%
4.5%
All nutrients comparison - raw data values
Nutrient
DV% diff.
Vitamin B12
2.67µg
1.87µg
33%
Fats
26.34g
5.82g
32%
Vitamin B1
0.38mg
0.052mg
27%
Zinc
2.47mg
4.98mg
23%
Protein
12.2g
21.8g
19%
Iron
1mg
2.22mg
15%
Choline
81.6mg
15%
Saturated fat
6.08g
2.681g
15%
Monounsaturated fat
8g
2.118g
15%
Sodium
848mg
1078mg
10%
Polyunsaturated fat
1.58g
0.145g
10%
Vitamin B5
0.69mg
0.265mg
9%
Calories
297kcal
147kcal
8%
Selenium
14.1µg
17.7µg
7%
Vitamin B3
3.11mg
4.26mg
7%
Phosphorus
130mg
175mg
6%
Vitamin B2
0.213mg
0.161mg
4%
Cholesterol
78mg
68mg
3%
Potassium
283mg
210mg
2%
Vitamin B6
0.2mg
0.221mg
2%
Carbs
2g
0.36g
1%
Vitamin D*
4 IU
1%
Vitamin D
0.1µg
1%
Copper
0.08mg
0.091mg
1%
Vitamin E
0.12mg
1%
Manganese
0.041mg
0.027mg
1%
Vitamin K
0.7µg
1%
Folate
4µg
6µg
1%
Protein per 100 calories
4.1g
15g
N/A
Calories per 10 g protein
243kcal
67kcal
N/A
Weight per 100 calories
34g
68g
N/A
Unsaturated / Saturated Fat ratio
1.6
0.84
N/A
Vitamin C
0mg
0.3mg
0%
Net carbs
2g
0.36g
N/A
Magnesium
15mg
17mg
0%
Calcium
7mg
10mg
0%
Sugar
0g
0.1g
N/A
Vitamin A
0µg
2µg
0%
Tryptophan
0.107mg
0.141mg
0%
Threonine
0.465mg
0.857mg
0%
Isoleucine
0.485mg
0.976mg
0%
Leucine
0.81mg
1.706mg
0%
Lysine
0.903mg
1.812mg
0%
Methionine
0.364mg
0.558mg
0%
Phenylalanine
0.405mg
0.847mg
0%
Valine
0.464mg
1.065mg
0%
Histidine
0.395mg
0.684mg
0%
Fructose
0.01g
0%
Macronutrient Comparison
Macronutrient breakdown side-by-side comparison
3
12%
26%
2%
57%
3%
Protein:
12.2 g
Fats:
26.34 g
Carbs:
2 g
Water:
56.65 g
Other:
2.81 g
2
22%
6%
70%
2%
Protein:
21.8 g
Fats:
5.82 g
Carbs:
0.36 g
Water:
69.53 g
Other:
2.49 g
Contains
more
Fats Fats
+352.6%
Contains
more
Carbs Carbs
+455.6%
Contains
more
Other Other
+12.9%
Contains
more
Protein Protein
+78.7%
Contains
more
Water Water
+22.7%
Fat Type Comparison
Fat type breakdown side-by-side comparison
2
39%
51%
10%
Saturated fat:
Sat. Fat
6.08 g
Monounsaturated fat:
Mono. Fat
8 g
Polyunsaturated fat:
Poly. Fat
1.58 g
1
54%
43%
3%
Saturated fat:
Sat. Fat
2.681 g
Monounsaturated fat:
Mono. Fat
2.118 g
Polyunsaturated fat:
Poly. Fat
0.145 g
Contains
more
Mono. Fat Monounsaturated fat
+277.7%
Contains
more
Poly. Fat Polyunsaturated fat
+989.7%
Contains
less
Sat. Fat Saturated fat
-55.9%