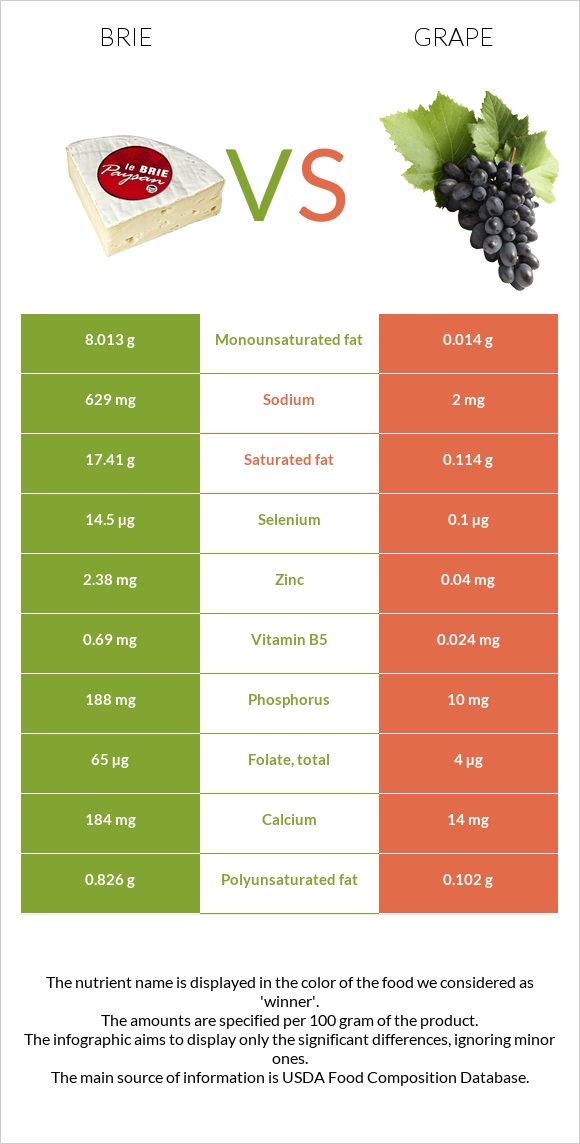
What are the differences between brie and grapes? Brie is higher in vitamin B12, vitamin B2, selenium, phosphorus, zinc, and calcium, yet grapes are higher in manganese. Brie's daily need coverage for saturated fat is 86% more. The amount of cholesterol in grapes is lower. The glycemic index of brie is lower. We used Cheese, brie and Grapes, american type (slip skin), raw types in this article.
Infographic
Mineral Comparison
Mineral comparison score is based on the number of minerals by which one or the other food is richer. The "coverage" charts below show how much of the daily needs can be covered by 300 grams of the food.
6
100 g
300 g
1 cubic inch - 17g 1 oz - 28.35g 1 package (4.5 oz) - 128g 1 cup, sliced - 144g 1 cup, melted - 240g
Magnesium
Magnesium
Calcium
Calcium
Potassium
Potassium
Iron
Iron
Copper
Copper
Zinc
Zinc
Phosphorus
Phosphorus
Sodium
Sodium
Manganese
Manganese
Selenium
Selenium
14%
55%
13%
19%
6.3%
65%
81%
82%
4.4%
79%
4
100 g
300 g
1 grape - 2.4g 1 cup - 92g
Magnesium
Magnesium
Calcium
Calcium
Potassium
Potassium
Iron
Iron
Copper
Copper
Zinc
Zinc
Phosphorus
Phosphorus
Sodium
Sodium
Manganese
Manganese
Selenium
Selenium
3.6%
4.2%
17%
11%
13%
1.1%
4.3%
0.26%
94%
0.55%
Vitamin Comparison
Vitamin comparison score is based on the number of vitamins by which one or the other food is richer. The "coverage" charts below show how much of the daily needs can be covered by 300 grams of the food.
9
100 g
300 g
1 cubic inch - 17g 1 oz - 28.35g 1 package (4.5 oz) - 128g 1 cup, sliced - 144g 1 cup, melted - 240g
Vitamin C
Vit. C
Vitamin D
Vit. D
Vitamin A
Vit. A
Vitamin E
Vit. E
Vitamin B1
Vit. B1
Vitamin B2
Vit. B2
Vitamin B3
Vit. B3
Vitamin B5
Vit. B5
Vitamin B6
Vit. B6
Vitamin B12
Vit. B12
Vitamin K
Vit. K
Folate
Folate
0%
7.5%
58%
4.8%
18%
120%
7.1%
41%
54%
206%
5.8%
49%
3
100 g
300 g
1 grape - 2.4g 1 cup - 92g
Vitamin C
Vit. C
Vitamin D
Vit. D
Vitamin A
Vit. A
Vitamin E
Vit. E
Vitamin B1
Vit. B1
Vitamin B2
Vit. B2
Vitamin B3
Vit. B3
Vitamin B5
Vit. B5
Vitamin B6
Vit. B6
Vitamin B12
Vit. B12
Vitamin K
Vit. K
Folate
Folate
13%
0%
1.7%
3.8%
23%
13%
5.6%
1.4%
25%
0%
37%
3%
All nutrients comparison - raw data values
Nutrient
DV% diff.
Saturated fat
17.41g
0.114g
79%
Vitamin B12
1.65µg
0µg
69%
Fats
27.68g
0.35g
42%
Protein
20.75g
0.63g
40%
Vitamin B2
0.52mg
0.057mg
36%
Cholesterol
100mg
0mg
33%
Manganese
0.034mg
0.718mg
30%
Sodium
629mg
2mg
27%
Selenium
14.5µg
0.1µg
26%
Phosphorus
188mg
10mg
25%
Zinc
2.38mg
0.04mg
21%
Monounsaturated fat
8.013g
0.014g
20%
Vitamin A
174µg
5µg
19%
Calcium
184mg
14mg
17%
Folate
65µg
4µg
15%
Calories
334kcal
67kcal
13%
Vitamin B5
0.69mg
0.024mg
13%
Vitamin B6
0.235mg
0.11mg
10%
Vitamin K
2.3µg
14.6µg
10%
Carbs
0.45g
17.15g
6%
Polyunsaturated fat
0.826g
0.102g
5%
Vitamin C
0mg
4mg
4%
Magnesium
20mg
5mg
4%
Fiber
0g
0.9g
4%
Vitamin D*
20 IU
0 IU
3%
Vitamin D
0.5µg
0µg
3%
Iron
0.5mg
0.29mg
3%
Copper
0.019mg
0.04mg
2%
Vitamin B1
0.07mg
0.092mg
2%
Choline
15.4mg
5.6mg
2%
Potassium
152mg
191mg
1%
Vitamin B3
0.38mg
0.3mg
1%
Protein per 100 calories
6.2g
0.94g
N/A
Calories per 10 g protein
161kcal
1063kcal
N/A
Weight per 100 calories
30g
149g
N/A
Unsaturated / Saturated Fat ratio
0.51
1
N/A
Net carbs
0.45g
16.25g
N/A
Sugar
0.45g
16.25g
N/A
Vitamin E
0.24mg
0.19mg
0%
Tryptophan
0.322mg
0.003mg
0%
Threonine
0.751mg
0.017mg
0%
Isoleucine
1.015mg
0.005mg
0%
Leucine
1.929mg
0.013mg
0%
Lysine
1.851mg
0.014mg
0%
Methionine
0.592mg
0.021mg
0%
Phenylalanine
1.158mg
0.013mg
0%
Valine
1.34mg
0.017mg
0%
Histidine
0.716mg
0.023mg
0%
Macronutrient Comparison
Macronutrient breakdown side-by-side comparison
3
21%
28%
48%
3%
Protein:
20.75 g
Fats:
27.68 g
Carbs:
0.45 g
Water:
48.42 g
Other:
2.7 g
2
17%
81%
Protein:
0.63 g
Fats:
0.35 g
Carbs:
17.15 g
Water:
81.3 g
Other:
0.57 g
Contains
more
Protein Protein
+3193.7%
Contains
more
Fats Fats
+7808.6%
Contains
more
Other Other
+373.7%
Contains
more
Carbs Carbs
+3711.1%
Contains
more
Water Water
+67.9%
Fat Type Comparison
Fat type breakdown side-by-side comparison
2
66%
31%
3%
Saturated fat:
Sat. Fat
17.41 g
Monounsaturated fat:
Mono. Fat
8.013 g
Polyunsaturated fat:
Poly. Fat
0.826 g
1
50%
6%
44%
Saturated fat:
Sat. Fat
0.114 g
Monounsaturated fat:
Mono. Fat
0.014 g
Polyunsaturated fat:
Poly. Fat
0.102 g
Contains
more
Mono. Fat Monounsaturated fat
+57135.7%
Contains
more
Poly. Fat Polyunsaturated fat
+709.8%
Contains
less
Sat. Fat Saturated fat
-99.3%