Brisket vs. Pot roast — In-Depth Nutrition Comparison
Compare
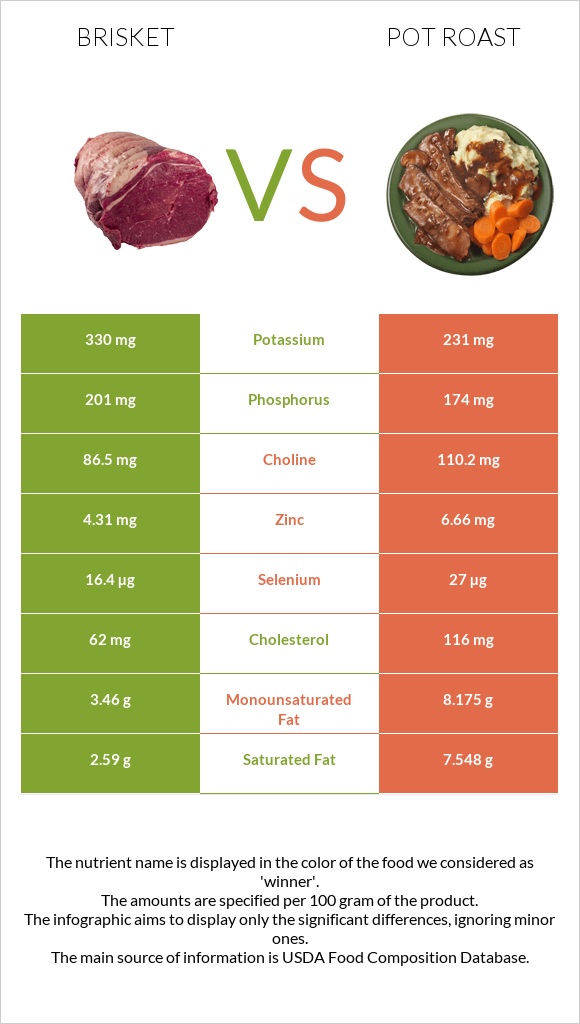
How are brisket and pot roast different?
Beef, brisket, flat half, separable lean, and fat, trimmed to 1/8" fat, all grades, cooked, braised and Beef, chuck, arm pot roast, separable lean, and fat, trimmed to 0" fat, all grades, cooked, braised are the varieties used in this article.
Infographic
Infographic link
Mineral Comparison
Mineral comparison score is based on the number of minerals by which one or the other food is richer. The "coverage" charts below show how much of the daily needs can be covered by 300 grams of the food.
Vitamin Comparison
Vitamin comparison score is based on the number of vitamins by which one or the other food is richer. The "coverage" charts below show how much of the daily needs can be covered by 300 grams of the food.
All nutrients comparison - raw data values
| Nutrient |  |
 |
DV% diff. |
| Cholesterol | 106mg | 116mg | 3% |
| Fats | 18.42g | 19.17g | 1% |
| Vitamin D* | 8 IU | 1% | |
| Vitamin D | 0.2µg | 1% | |
| Saturated fat | 7.305g | 7.548g | 1% |
| Monounsaturated fat | 7.934g | 8.175g | 1% |
| Calories | 289kcal | 297kcal | 0% |
| Protein | 28.82g | 28.94g | 0% |
| Protein per 100 calories | 10g | 9.7g | N/A |
| Calories per 10 g protein | 100kcal | 103kcal | N/A |
| Weight per 100 calories | 35g | 34g | N/A |
| Unsaturated / Saturated Fat ratio | 1.2 | 1.2 | N/A |
| Magnesium | 19mg | 19mg | 0% |
| Calcium | 16mg | 16mg | 0% |
| Potassium | 232mg | 231mg | 0% |
| Iron | 2.43mg | 2.42mg | 0% |
| Copper | 0.1mg | 0.099mg | 0% |
| Zinc | 6.69mg | 6.66mg | 0% |
| Phosphorus | 175mg | 174mg | 0% |
| Sodium | 48mg | 47mg | 0% |
| Vitamin E | 0.51mg | 0.51mg | 0% |
| Manganese | 0.01mg | 0.01mg | 0% |
| Selenium | 27.1µg | 27µg | 0% |
| Vitamin B1 | 0.059mg | 0.059mg | 0% |
| Vitamin B2 | 0.171mg | 0.171mg | 0% |
| Vitamin B3 | 4.087mg | 4.105mg | 0% |
| Vitamin B5 | 0.568mg | 0.571mg | 0% |
| Vitamin B6 | 0.282mg | 0.283mg | 0% |
| Vitamin B12 | 2.12µg | 2.13µg | 0% |
| Vitamin K | 1.8µg | 1.8µg | 0% |
| Folate | 9µg | 9µg | 0% |
| Choline | 109.8mg | 110.2mg | 0% |
| Polyunsaturated fat | 0.681g | 0.708g | 0% |
| Tryptophan | 0.181mg | 0.19mg | 0% |
| Threonine | 1.101mg | 1.156mg | 0% |
| Isoleucine | 1.253mg | 1.317mg | 0% |
| Leucine | 2.192mg | 2.302mg | 0% |
| Lysine | 2.328mg | 2.446mg | 0% |
| Methionine | 0.717mg | 0.754mg | 0% |
| Phenylalanine | 1.088mg | 1.143mg | 0% |
| Valine | 1.367mg | 1.436mg | 0% |
| Histidine | 0.879mg | 0.924mg | 0% |
Macronutrient Comparison
Macronutrient breakdown side-by-side comparison
| Contains more OtherOther | +∞% |
~equal in
Protein
~28.94g
~equal in
Fats
~19.17g
~equal in
Carbs
~0g
~equal in
Water
~51.9g
Fat Type Comparison
Fat type breakdown side-by-side comparison
~equal in
Saturated fat
~7.548g
~equal in
Monounsaturated fat
~8.175g
~equal in
Polyunsaturated fat
~0.708g


