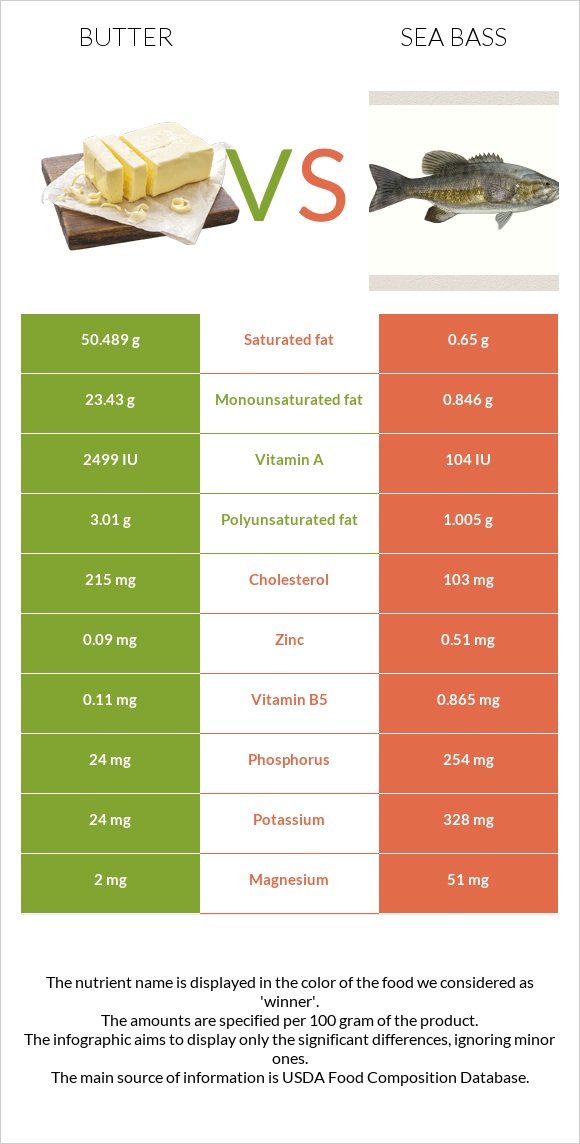
Summary of differences between butter and sea bass Butter has more vitamin A; however, sea bass is higher in vitamin B12, selenium, phosphorus, vitamin B6, vitamin B3, vitamin B5, and iron. Butter covers your daily need for saturated fat, 249% more than sea bass. Butter has 24 times more vitamin A than sea bass. While butter has 2499 IU of vitamin A, sea bass has only 104 IU. Sea bass has less saturated fat. These are the specific foods used in this comparison Butter, without salt and Fish, bass, striped, cooked, dry heat .
Infographic
Mineral Comparison
Mineral comparison score is based on the number of minerals by which one or the other food is richer. The "coverage" charts below show how much of the daily needs can be covered by 300 grams of the food.
2
100 g
300 g
1 pat (1" sq, 1/3" high) - 5g 1 tbsp - 14.2g 1 stick - 113g 1 cup - 227g
Magnesium
Magnesium
Calcium
Calcium
Potassium
Potassium
Iron
Iron
Copper
Copper
Zinc
Zinc
Phosphorus
Phosphorus
Sodium
Sodium
Manganese
Manganese
Selenium
Selenium
1.4%
7.2%
2.1%
0.75%
5.3%
2.5%
10%
1.4%
0.52%
5.5%
8
100 g
300 g
3 oz - 85g 1 fillet - 124g
Magnesium
Magnesium
Calcium
Calcium
Potassium
Potassium
Iron
Iron
Copper
Copper
Zinc
Zinc
Phosphorus
Phosphorus
Sodium
Sodium
Manganese
Manganese
Selenium
Selenium
36%
5.7%
29%
41%
13%
14%
109%
11%
2.5%
255%
Vitamin Comparison
Vitamin comparison score is based on the number of vitamins by which one or the other food is richer. The "coverage" charts below show how much of the daily needs can be covered by 300 grams of the food.
3
100 g
300 g
1 pat (1" sq, 1/3" high) - 5g 1 tbsp - 14.2g 1 stick - 113g 1 cup - 227g
Vitamin C
Vit. C
Vitamin D
Vit. D
Vitamin A
Vit. A
Vitamin E
Vit. E
Vitamin B1
Vit. B1
Vitamin B2
Vit. B2
Vitamin B3
Vit. B3
Vitamin B5
Vit. B5
Vitamin B6
Vit. B6
Vitamin B12
Vit. B12
Vitamin K
Vit. K
Folate
Folate
0%
0%
228%
46%
1.3%
7.8%
0.79%
6.6%
0.69%
21%
18%
2.3%
6
100 g
300 g
3 oz - 85g 1 fillet - 124g
Vitamin C
Vit. C
Vitamin D
Vit. D
Vitamin A
Vit. A
Vitamin E
Vit. E
Vitamin B1
Vit. B1
Vitamin B2
Vit. B2
Vitamin B3
Vit. B3
Vitamin B5
Vit. B5
Vitamin B6
Vit. B6
Vitamin B12
Vit. B12
Vitamin K
Vit. K
Folate
Folate
0%
0%
10%
0%
29%
8.5%
48%
52%
80%
551%
0%
7.5%
All nutrients comparison - raw data values
Nutrient
DV% diff.
Saturated fat
50.489g
0.65g
227%
Vitamin B12
0.17µg
4.41µg
177%
Fats
81.11g
2.99g
120%
Selenium
1µg
46.8µg
83%
Vitamin A
684µg
31µg
73%
Monounsaturated fat
23.43g
0.846g
56%
Protein
0.85g
22.73g
44%
Cholesterol
215mg
103mg
37%
Phosphorus
24mg
254mg
33%
Calories
717kcal
124kcal
30%
Vitamin B6
0.003mg
0.346mg
26%
Vitamin B3
0.042mg
2.558mg
16%
Vitamin E
2.32mg
15%
Vitamin B5
0.11mg
0.865mg
15%
Iron
0.02mg
1.08mg
13%
Polyunsaturated fat
3.01g
1.005g
13%
Magnesium
2mg
51mg
12%
Potassium
24mg
328mg
9%
Vitamin B1
0.005mg
0.115mg
9%
Vitamin K
7µg
6%
Zinc
0.09mg
0.51mg
4%
Copper
0.016mg
0.04mg
3%
Sodium
11mg
88mg
3%
Choline
18.8mg
3%
Folate
3µg
10µg
2%
Calcium
24mg
19mg
1%
Manganese
0.004mg
0.019mg
1%
Protein per 100 calories
0.12g
18g
N/A
Calories per 10 g protein
8435kcal
55kcal
N/A
Weight per 100 calories
14g
81g
N/A
Unsaturated / Saturated Fat ratio
0.52
2.8
N/A
Net carbs
0.06g
0g
N/A
Carbs
0.06g
0g
0%
Sugar
0.06g
N/A
Vitamin B2
0.034mg
0.037mg
0%
Tryptophan
0.012mg
0.255mg
0%
Threonine
0.038mg
0.997mg
0%
Isoleucine
0.051mg
1.047mg
0%
Leucine
0.083mg
1.848mg
0%
Lysine
0.067mg
2.088mg
0%
Methionine
0.021mg
0.673mg
0%
Phenylalanine
0.041mg
0.887mg
0%
Valine
0.057mg
1.171mg
0%
Histidine
0.023mg
0.669mg
0%
Omega-3 - EPA
0g
0.217g
N/A
Omega-3 - DHA
0g
0.75g
N/A
Omega-3 - ALA
0.315g
N/A
Omega-6 - Linoleic acid
2.166g
N/A
Macronutrient Comparison
Macronutrient breakdown side-by-side comparison
2
81%
18%
Protein:
0.85 g
Fats:
81.11 g
Carbs:
0.06 g
Water:
17.94 g
Other:
0.04 g
3
23%
3%
73%
Protein:
22.73 g
Fats:
2.99 g
Carbs:
0 g
Water:
73.36 g
Other:
0.92 g
Contains
more
Fats Fats
+2612.7%
Contains
more
Carbs Carbs
+∞%
Contains
more
Protein Protein
+2574.1%
Contains
more
Water Water
+308.9%
Contains
more
Other Other
+2200%
Fat Type Comparison
Fat type breakdown side-by-side comparison
2
66%
30%
4%
Saturated fat:
Sat. Fat
50.489 g
Monounsaturated fat:
Mono. Fat
23.43 g
Polyunsaturated fat:
Poly. Fat
3.01 g
1
26%
34%
40%
Saturated fat:
Sat. Fat
0.65 g
Monounsaturated fat:
Mono. Fat
0.846 g
Polyunsaturated fat:
Poly. Fat
1.005 g
Contains
more
Mono. Fat Monounsaturated fat
+2669.5%
Contains
more
Poly. Fat Polyunsaturated fat
+199.5%
Contains
less
Sat. Fat Saturated fat
-98.7%