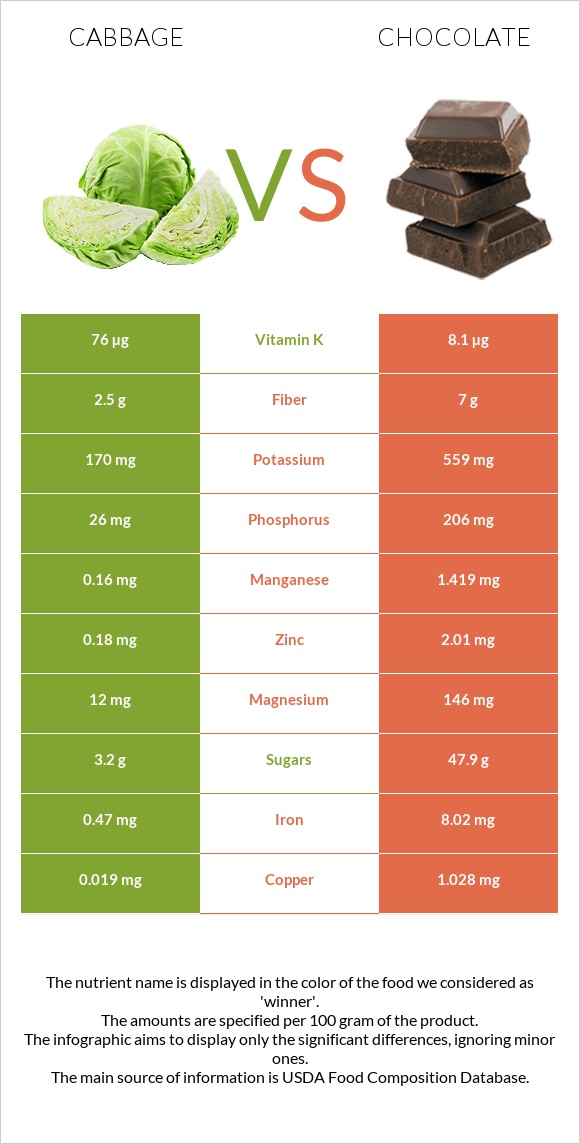
Differences between cabbage and chocolate Cabbage has more vitamin K, while chocolate has more copper, iron, manganese, magnesium, phosphorus, fiber, zinc, and potassium. Chocolate's daily need coverage for copper is 112% higher. Chocolate contains 9 times less vitamin K than cabbage. Cabbage contains 76µg of vitamin K, while chocolate contains 8.1µg. The amount of saturated fat in cabbage is lower. The food types used in this comparison are Cabbage, raw and Chocolate, dark, 45- 59% cacao solids .
Infographic
Mineral Comparison
Mineral comparison score is based on the number of minerals by which one or the other food is richer. The "coverage" charts below show how much of the daily needs can be covered by 300 grams of the food.
1
100 g
300 g
1 leaf - 15g 1 leaf, medium - 23g 1 leaf, large - 33g 1 cup, shredded - 70g 1 cup, chopped - 89g 1 head, small (about 4-1/2" dia) - 714g 1 head, medium (about 5-3/4" dia) - 908g 1 head, large (about 7" dia) - 1248g
Magnesium
Magnesium
Calcium
Calcium
Potassium
Potassium
Iron
Iron
Copper
Copper
Zinc
Zinc
Phosphorus
Phosphorus
Sodium
Sodium
Manganese
Manganese
Selenium
Selenium
8.6%
12%
15%
18%
6.3%
4.9%
11%
2.3%
21%
1.6%
9
100 g
300 g
1 oz - 28.35g 1 bar - 162g
Magnesium
Magnesium
Calcium
Calcium
Potassium
Potassium
Iron
Iron
Copper
Copper
Zinc
Zinc
Phosphorus
Phosphorus
Sodium
Sodium
Manganese
Manganese
Selenium
Selenium
104%
17%
49%
301%
343%
55%
88%
3.1%
185%
16%
Vitamin Comparison
Vitamin comparison score is based on the number of vitamins by which one or the other food is richer. The "coverage" charts below show how much of the daily needs can be covered by 300 grams of the food.
6
100 g
300 g
1 leaf - 15g 1 leaf, medium - 23g 1 leaf, large - 33g 1 cup, shredded - 70g 1 cup, chopped - 89g 1 head, small (about 4-1/2" dia) - 714g 1 head, medium (about 5-3/4" dia) - 908g 1 head, large (about 7" dia) - 1248g
Vitamin C
Vit. C
Vitamin D
Vit. D
Vitamin A
Vit. A
Vitamin E
Vit. E
Vitamin B1
Vit. B1
Vitamin B2
Vit. B2
Vitamin B3
Vit. B3
Vitamin B5
Vit. B5
Vitamin B6
Vit. B6
Vitamin B12
Vit. B12
Vitamin K
Vit. K
Folate
Folate
122%
0%
1.7%
3%
15%
9.2%
4.4%
13%
29%
0%
190%
32%
5
100 g
300 g
1 oz - 28.35g 1 bar - 162g
Vitamin C
Vit. C
Vitamin D
Vit. D
Vitamin A
Vit. A
Vitamin E
Vit. E
Vitamin B1
Vit. B1
Vitamin B2
Vit. B2
Vitamin B3
Vit. B3
Vitamin B5
Vit. B5
Vitamin B6
Vit. B6
Vitamin B12
Vit. B12
Vitamin K
Vit. K
Folate
Folate
0%
0%
0.67%
11%
6.3%
12%
14%
18%
9.7%
29%
20%
0%
All nutrients comparison - raw data values
Nutrient
DV% diff.
Copper
0.019mg
1.028mg
112%
Iron
0.47mg
8.02mg
94%
Saturated fat
0.034g
18.519g
84%
Vitamin K
76µg
8.1µg
57%
Manganese
0.16mg
1.419mg
55%
Fats
0.1g
31.28g
48%
Vitamin C
36.6mg
41%
Magnesium
12mg
146mg
32%
Calories
25kcal
546kcal
26%
Phosphorus
26mg
206mg
26%
Monounsaturated fat
0.017g
9.54g
24%
Carbs
5.8g
61.17g
18%
Fiber
2.5g
7g
18%
Zinc
0.18mg
2.01mg
17%
Potassium
170mg
559mg
11%
Folate
43µg
11%
Caffeine
0mg
43mg
11%
Vitamin B12
0µg
0.23µg
10%
Protein
1.28g
4.88g
7%
Polyunsaturated fat
0.017g
1.092g
7%
Vitamin B6
0.124mg
0.042mg
6%
Selenium
0.3µg
3µg
5%
Cholesterol
0mg
8mg
3%
Vitamin E
0.15mg
0.54mg
3%
Vitamin B1
0.061mg
0.025mg
3%
Vitamin B3
0.234mg
0.725mg
3%
Calcium
40mg
56mg
2%
Vitamin B5
0.212mg
0.297mg
2%
Choline
10.7mg
2%
Fructose
1.45g
0g
2%
Vitamin B2
0.04mg
0.05mg
1%
Protein per 100 calories
5.1g
0.89g
N/A
Calories per 10 g protein
195kcal
1119kcal
N/A
Weight per 100 calories
400g
18g
N/A
Unsaturated / Saturated Fat ratio
1
0.57
N/A
Net carbs
3.3g
54.17g
N/A
Sugar
3.2g
47.9g
N/A
Sodium
18mg
24mg
0%
Vitamin A
5µg
2µg
0%
Trans fat
0g
0.112g
N/A
Tryptophan
0.011mg
0%
Threonine
0.035mg
0%
Isoleucine
0.03mg
0%
Leucine
0.041mg
0%
Lysine
0.044mg
0%
Methionine
0.012mg
0%
Phenylalanine
0.032mg
0%
Valine
0.042mg
0%
Histidine
0.022mg
0%
Omega-3 - EPA
0g
0.001g
N/A
Omega-3 - ALA
0.085g
N/A
Omega-6 - Eicosadienoic acid
0g
0.001g
N/A
Omega-6 - Linoleic acid
0.947g
N/A
Macronutrient Comparison
Macronutrient breakdown side-by-side comparison
1
6%
92%
Protein:
1.28 g
Fats:
0.1 g
Carbs:
5.8 g
Water:
92.18 g
Other:
0.64 g
4
5%
31%
61%
2%
Protein:
4.88 g
Fats:
31.28 g
Carbs:
61.17 g
Water:
0.97 g
Other:
1.7 g
Contains
more
Water Water
+9403.1%
Contains
more
Protein Protein
+281.3%
Contains
more
Fats Fats
+31180%
Contains
more
Carbs Carbs
+954.7%
Contains
more
Other Other
+165.6%
Fat Type Comparison
Fat type breakdown side-by-side comparison
1
50%
25%
25%
Saturated fat:
Sat. Fat
0.034 g
Monounsaturated fat:
Mono. Fat
0.017 g
Polyunsaturated fat:
Poly. Fat
0.017 g
2
64%
33%
4%
Saturated fat:
Sat. Fat
18.519 g
Monounsaturated fat:
Mono. Fat
9.54 g
Polyunsaturated fat:
Poly. Fat
1.092 g
Contains
less
Sat. Fat Saturated fat
-99.8%
Contains
more
Mono. Fat Monounsaturated fat
+56017.6%
Contains
more
Poly. Fat Polyunsaturated fat
+6323.5%
Carbohydrate type comparison
Carbohydrate type breakdown side-by-side comparison
3
2%
52%
45%
Starch:
0 g
Sucrose:
0.08 g
Glucose:
1.67 g
Fructose:
1.45 g
Lactose:
0 g
Maltose:
0.01 g
Galactose:
0 g
2
97%
3%
Starch:
0 g
Sucrose:
46.25 g
Glucose:
0 g
Fructose:
0 g
Lactose:
1.65 g
Maltose:
0 g
Galactose:
0 g
Contains
more
Glucose Glucose
+∞%
Contains
more
Fructose Fructose
+∞%
Contains
more
Maltose Maltose
+∞%
Contains
more
Sucrose Sucrose
+57712.5%
Contains
more
Lactose Lactose
+∞%
~equal in
Starch
~0g
~equal in
Galactose
~0g