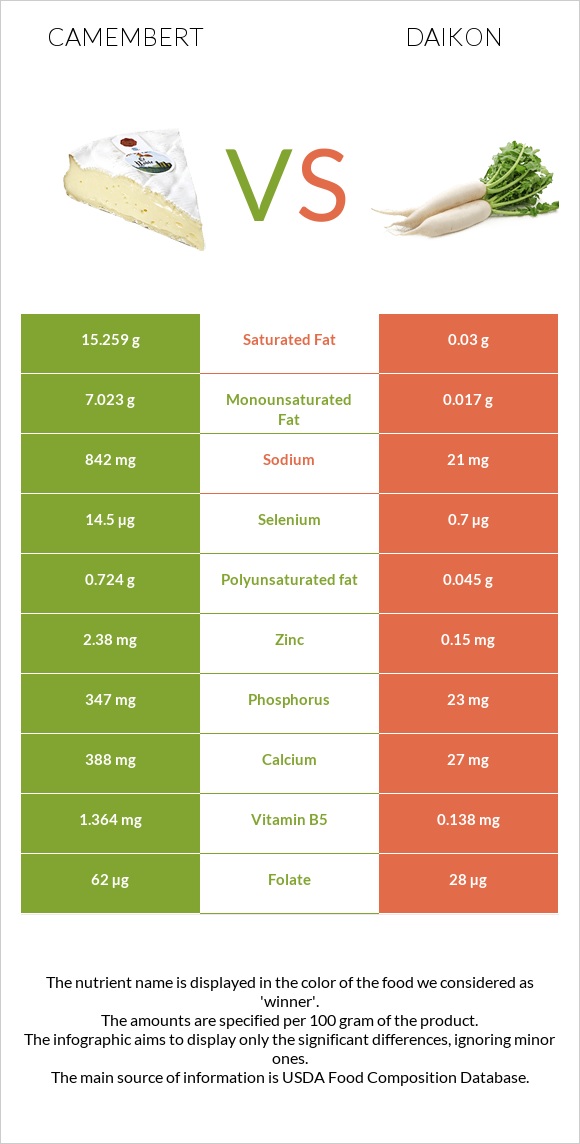
What are the differences between camembert and daikon? Camembert is higher in vitamin B12, phosphorus, calcium, vitamin B2, selenium, and vitamin B5, yet daikon is higher in vitamin C. Camembert's daily need coverage for saturated fat is 76% more. The amount of cholesterol in daikon is lower. We used Cheese, camembert and Radishes, oriental, raw types in this article.
Infographic
Mineral Comparison
Mineral comparison score is based on the number of minerals by which one or the other food is richer. The "coverage" charts below show how much of the daily needs can be covered by 300 grams of the food.
5
100 g
300 g
1 cubic inch - 17g 1 oz - 28.35g 1 wedge (1.33 oz) - 38g 1 cup - 246g
Magnesium
Magnesium
Calcium
Calcium
Potassium
Potassium
Iron
Iron
Copper
Copper
Zinc
Zinc
Phosphorus
Phosphorus
Sodium
Sodium
Manganese
Manganese
Selenium
Selenium
14%
116%
17%
12%
7%
65%
149%
110%
5%
79%
4
100 g
300 g
1 cup slices - 116g 1 radish (7" long) - 338g
Magnesium
Magnesium
Calcium
Calcium
Potassium
Potassium
Iron
Iron
Copper
Copper
Zinc
Zinc
Phosphorus
Phosphorus
Sodium
Sodium
Manganese
Manganese
Selenium
Selenium
11%
8.1%
20%
15%
38%
4.1%
9.9%
2.7%
5%
3.8%
Vitamin Comparison
Vitamin comparison score is based on the number of vitamins by which one or the other food is richer. The "coverage" charts below show how much of the daily needs can be covered by 300 grams of the food.
11
100 g
300 g
1 cubic inch - 17g 1 oz - 28.35g 1 wedge (1.33 oz) - 38g 1 cup - 246g
Vitamin C
Vit. C
Vitamin D
Vit. D
Vitamin A
Vit. A
Vitamin E
Vit. E
Vitamin B1
Vit. B1
Vitamin B2
Vit. B2
Vitamin B3
Vit. B3
Vitamin B5
Vit. B5
Vitamin B6
Vit. B6
Vitamin B12
Vit. B12
Vitamin K
Vit. K
Folate
Folate
0%
6%
80%
4.2%
7%
113%
12%
82%
52%
163%
5%
47%
1
100 g
300 g
1 cup slices - 116g 1 radish (7" long) - 338g
Vitamin C
Vit. C
Vitamin D
Vit. D
Vitamin A
Vit. A
Vitamin E
Vit. E
Vitamin B1
Vit. B1
Vitamin B2
Vit. B2
Vitamin B3
Vit. B3
Vitamin B5
Vit. B5
Vitamin B6
Vit. B6
Vitamin B12
Vit. B12
Vitamin K
Vit. K
Folate
Folate
73%
0%
0%
0%
5%
4.6%
3.8%
8.3%
11%
0%
0.75%
21%
All nutrients comparison - raw data values
Nutrient
DV% diff.
Saturated fat
15.259g
0.03g
69%
Vitamin B12
1.3µg
0µg
54%
Phosphorus
347mg
23mg
46%
Protein
19.8g
0.6g
38%
Fats
24.26g
0.1g
37%
Calcium
388mg
27mg
36%
Sodium
842mg
21mg
36%
Vitamin B2
0.488mg
0.02mg
36%
Vitamin A
241µg
0µg
27%
Selenium
14.5µg
0.7µg
25%
Vitamin B5
1.364mg
0.138mg
25%
Vitamin C
0mg
22mg
24%
Cholesterol
72mg
0mg
24%
Zinc
2.38mg
0.15mg
20%
Monounsaturated fat
7.023g
0.017g
18%
Calories
300kcal
18kcal
14%
Vitamin B6
0.227mg
0.046mg
14%
Copper
0.021mg
0.115mg
10%
Folate
62µg
28µg
9%
Fiber
0g
1.6g
6%
Polyunsaturated fat
0.724g
0.045g
5%
Vitamin B3
0.63mg
0.2mg
3%
Vitamin D*
18 IU
0 IU
2%
Vitamin D
0.4µg
0µg
2%
Carbs
0.46g
4.1g
1%
Magnesium
20mg
16mg
1%
Potassium
187mg
227mg
1%
Iron
0.33mg
0.4mg
1%
Vitamin E
0.21mg
0mg
1%
Vitamin B1
0.028mg
0.02mg
1%
Vitamin K
2µg
0.3µg
1%
Choline
15.4mg
7.3mg
1%
Protein per 100 calories
6.6g
3.3g
N/A
Calories per 10 g protein
152kcal
300kcal
N/A
Weight per 100 calories
33g
556g
N/A
Unsaturated / Saturated Fat ratio
0.51
2.1
N/A
Net carbs
0.46g
2.5g
N/A
Sugar
0.46g
2.5g
N/A
Manganese
0.038mg
0.038mg
0%
Tryptophan
0.307mg
0.003mg
0%
Threonine
0.717mg
0.025mg
0%
Isoleucine
0.968mg
0.026mg
0%
Leucine
1.84mg
0.031mg
0%
Lysine
1.766mg
0.03mg
0%
Methionine
0.565mg
0.006mg
0%
Phenylalanine
1.105mg
0.02mg
0%
Valine
1.279mg
0.028mg
0%
Histidine
0.683mg
0.011mg
0%
Macronutrient Comparison
Macronutrient breakdown side-by-side comparison
3
20%
24%
52%
4%
Protein:
19.8 g
Fats:
24.26 g
Carbs:
0.46 g
Water:
51.8 g
Other:
3.68 g
2
4%
95%
Protein:
0.6 g
Fats:
0.1 g
Carbs:
4.1 g
Water:
94.62 g
Other:
0.58 g
Contains
more
Protein Protein
+3200%
Contains
more
Fats Fats
+24160%
Contains
more
Other Other
+534.5%
Contains
more
Carbs Carbs
+791.3%
Contains
more
Water Water
+82.7%
Fat Type Comparison
Fat type breakdown side-by-side comparison
2
66%
31%
3%
Saturated fat:
Sat. Fat
15.259 g
Monounsaturated fat:
Mono. Fat
7.023 g
Polyunsaturated fat:
Poly. Fat
0.724 g
1
33%
18%
49%
Saturated fat:
Sat. Fat
0.03 g
Monounsaturated fat:
Mono. Fat
0.017 g
Polyunsaturated fat:
Poly. Fat
0.045 g
Contains
more
Mono. Fat Monounsaturated fat
+41211.8%
Contains
more
Poly. Fat Polyunsaturated fat
+1508.9%
Contains
less
Sat. Fat Saturated fat
-99.8%