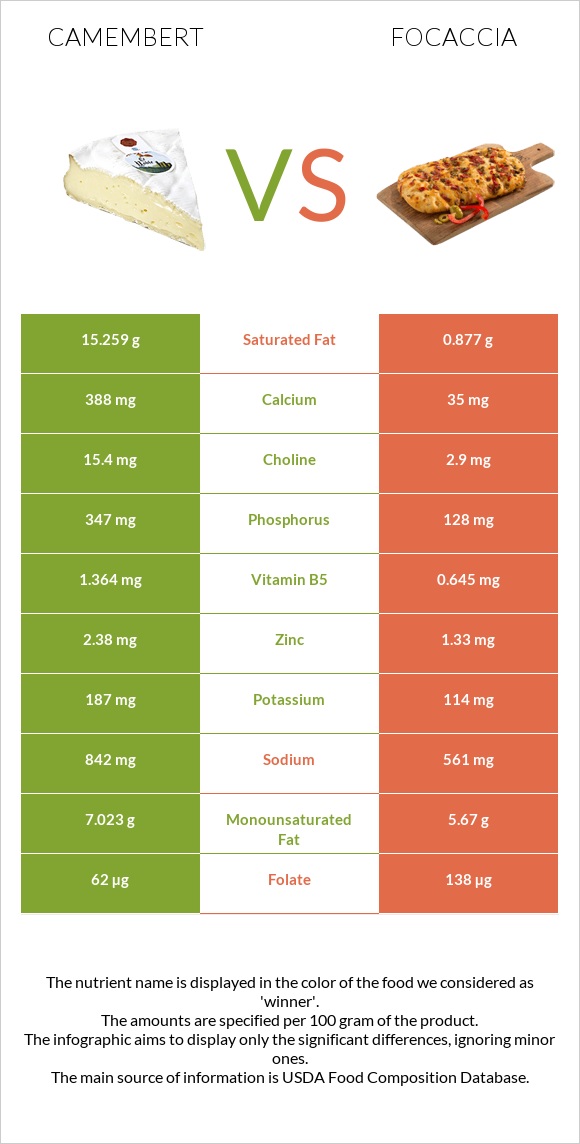
Significant differences between camembert and focaccia Camembert has more vitamin B12, calcium, phosphorus, and vitamin A; however, focaccia is richer in vitamin B1, iron, vitamin B3, and folate. Camembert covers your daily saturated fat needs 72% more than focaccia. Focaccia contains less cholesterol. Focaccia has a higher glycemic index. The glycemic index of focaccia is 63, while the glycemic index of camembert is 27. Specific food types used in this comparison are Cheese, camembert and Focaccia, Italian flatbread, plain .
Infographic
Mineral Comparison
Mineral comparison score is based on the number of minerals by which one or the other food is richer. The "coverage" charts below show how much of the daily needs can be covered by 300 grams of the food.
4
100 g
300 g
1 cubic inch - 17g 1 oz - 28.35g 1 wedge (1.33 oz) - 38g 1 cup - 246g
Magnesium
Magnesium
Calcium
Calcium
Potassium
Potassium
Iron
Iron
Copper
Copper
Zinc
Zinc
Phosphorus
Phosphorus
Sodium
Sodium
Manganese
Manganese
Selenium
Selenium
14%
116%
17%
12%
7%
65%
149%
110%
5%
79%
4
100 g
300 g
1 piece - 57g
Magnesium
Magnesium
Calcium
Calcium
Potassium
Potassium
Iron
Iron
Copper
Copper
Zinc
Zinc
Phosphorus
Phosphorus
Sodium
Sodium
Manganese
Manganese
Selenium
Selenium
14%
11%
10%
119%
30%
36%
55%
73%
47%
87%
Vitamin Comparison
Vitamin comparison score is based on the number of vitamins by which one or the other food is richer. The "coverage" charts below show how much of the daily needs can be covered by 300 grams of the food.
6
100 g
300 g
1 cubic inch - 17g 1 oz - 28.35g 1 wedge (1.33 oz) - 38g 1 cup - 246g
Vitamin C
Vit. C
Vitamin D
Vit. D
Vitamin A
Vit. A
Vitamin E
Vit. E
Vitamin B1
Vit. B1
Vitamin B2
Vit. B2
Vitamin B3
Vit. B3
Vitamin B5
Vit. B5
Vitamin B6
Vit. B6
Vitamin B12
Vit. B12
Vitamin K
Vit. K
Folate
Folate
0%
6%
80%
4.2%
7%
113%
12%
82%
52%
163%
5%
47%
5
100 g
300 g
1 piece - 57g
Vitamin C
Vit. C
Vitamin D
Vit. D
Vitamin A
Vit. A
Vitamin E
Vit. E
Vitamin B1
Vit. B1
Vitamin B2
Vit. B2
Vitamin B3
Vit. B3
Vitamin B5
Vit. B5
Vitamin B6
Vit. B6
Vitamin B12
Vit. B12
Vitamin K
Vit. K
Folate
Folate
0%
0%
0%
28%
118%
69%
69%
39%
26%
0%
14%
104%
All nutrients comparison - raw data values
Nutrient
DV% diff.
Saturated fat
15.259g
0.877g
65%
Vitamin B12
1.3µg
0µg
54%
Vitamin B1
0.028mg
0.47mg
37%
Calcium
388mg
35mg
35%
Iron
0.33mg
3.16mg
35%
Phosphorus
347mg
128mg
31%
Vitamin A
241µg
0µg
27%
Fats
24.26g
7.89g
25%
Cholesterol
72mg
0mg
24%
Protein
19.8g
8.77g
22%
Vitamin B3
0.63mg
3.67mg
19%
Folate
62µg
138µg
19%
Manganese
0.038mg
0.364mg
14%
Vitamin B2
0.488mg
0.301mg
14%
Vitamin B5
1.364mg
0.645mg
14%
Carbs
0.46g
35.82g
12%
Sodium
842mg
561mg
12%
Zinc
2.38mg
1.33mg
10%
Vitamin B6
0.227mg
0.113mg
9%
Copper
0.021mg
0.091mg
8%
Vitamin E
0.21mg
1.42mg
8%
Fiber
0g
1.8g
7%
Calories
300kcal
249kcal
3%
Selenium
14.5µg
15.9µg
3%
Vitamin K
2µg
5.7µg
3%
Monounsaturated fat
7.023g
5.67g
3%
Vitamin D*
18 IU
0 IU
2%
Vitamin D
0.4µg
0µg
2%
Potassium
187mg
114mg
2%
Choline
15.4mg
2.9mg
2%
Polyunsaturated fat
0.724g
0.994g
2%
Protein per 100 calories
6.6g
3.5g
N/A
Calories per 10 g protein
152kcal
284kcal
N/A
Weight per 100 calories
33g
40g
N/A
Unsaturated / Saturated Fat ratio
0.51
7.6
N/A
Net carbs
0.46g
34.02g
N/A
Magnesium
20mg
20mg
0%
Sugar
0.46g
1.75g
N/A
Tryptophan
0.307mg
0%
Threonine
0.717mg
0%
Isoleucine
0.968mg
0%
Leucine
1.84mg
0%
Lysine
1.766mg
0%
Methionine
0.565mg
0%
Phenylalanine
1.105mg
0%
Valine
1.279mg
0%
Histidine
0.683mg
0%
Macronutrient Comparison
Macronutrient breakdown side-by-side comparison
4
20%
24%
52%
4%
Protein:
19.8 g
Fats:
24.26 g
Carbs:
0.46 g
Water:
51.8 g
Other:
3.68 g
1
9%
8%
36%
46%
Protein:
8.77 g
Fats:
7.89 g
Carbs:
35.82 g
Water:
45.91 g
Other:
1.61 g
Contains
more
Protein Protein
+125.8%
Contains
more
Fats Fats
+207.5%
Contains
more
Water Water
+12.8%
Contains
more
Other Other
+128.6%
Contains
more
Carbs Carbs
+7687%
Fat Type Comparison
Fat type breakdown side-by-side comparison
1
66%
31%
3%
Saturated fat:
Sat. Fat
15.259 g
Monounsaturated fat:
Mono. Fat
7.023 g
Polyunsaturated fat:
Poly. Fat
0.724 g
2
12%
75%
13%
Saturated fat:
Sat. Fat
0.877 g
Monounsaturated fat:
Mono. Fat
5.67 g
Polyunsaturated fat:
Poly. Fat
0.994 g
Contains
more
Mono. Fat Monounsaturated fat
+23.9%
Contains
less
Sat. Fat Saturated fat
-94.3%
Contains
more
Poly. Fat Polyunsaturated fat
+37.3%