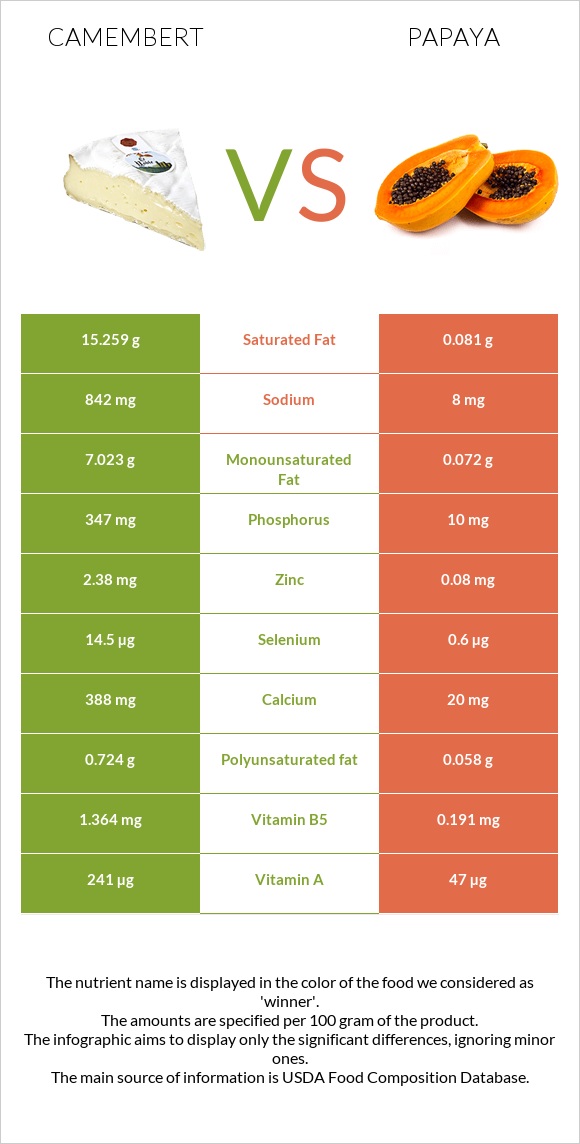
Summary of differences between camembert and papaya Camembert has more vitamin B12, phosphorus, calcium, vitamin B2, selenium, and vitamin B5; however, papaya is higher in vitamin C. Camembert covers your daily need for saturated fat, 76% more than papaya. Papaya has less cholesterol. The glycemic index of papaya is higher. These are the specific foods used in this comparison Cheese, camembert and Papayas, raw .
Infographic
Mineral Comparison
Mineral comparison score is based on the number of minerals by which one or the other food is richer. The "coverage" charts below show how much of the daily needs can be covered by 300 grams of the food.
5
100 g
300 g
1 cubic inch - 17g 1 oz - 28.35g 1 wedge (1.33 oz) - 38g 1 cup - 246g
Magnesium
Magnesium
Calcium
Calcium
Potassium
Potassium
Iron
Iron
Copper
Copper
Zinc
Zinc
Phosphorus
Phosphorus
Sodium
Sodium
Manganese
Manganese
Selenium
Selenium
14%
116%
17%
12%
7%
65%
149%
110%
5%
79%
2
100 g
300 g
1 cup 1" pieces - 145g 1 fruit, small - 157g 1 cup, mashed - 230g 1 fruit, large - 781g
Magnesium
Magnesium
Calcium
Calcium
Potassium
Potassium
Iron
Iron
Copper
Copper
Zinc
Zinc
Phosphorus
Phosphorus
Sodium
Sodium
Manganese
Manganese
Selenium
Selenium
15%
6%
16%
9.4%
15%
2.2%
4.3%
1%
5.2%
3.3%
Vitamin Comparison
Vitamin comparison score is based on the number of vitamins by which one or the other food is richer. The "coverage" charts below show how much of the daily needs can be covered by 300 grams of the food.
9
100 g
300 g
1 cubic inch - 17g 1 oz - 28.35g 1 wedge (1.33 oz) - 38g 1 cup - 246g
Vitamin C
Vit. C
Vitamin D
Vit. D
Vitamin A
Vit. A
Vitamin E
Vit. E
Vitamin B1
Vit. B1
Vitamin B2
Vit. B2
Vitamin B3
Vit. B3
Vitamin B5
Vit. B5
Vitamin B6
Vit. B6
Vitamin B12
Vit. B12
Vitamin K
Vit. K
Folate
Folate
0%
6%
80%
4.2%
7%
113%
12%
82%
52%
163%
5%
47%
3
100 g
300 g
1 cup 1" pieces - 145g 1 fruit, small - 157g 1 cup, mashed - 230g 1 fruit, large - 781g
Vitamin C
Vit. C
Vitamin D
Vit. D
Vitamin A
Vit. A
Vitamin E
Vit. E
Vitamin B1
Vit. B1
Vitamin B2
Vit. B2
Vitamin B3
Vit. B3
Vitamin B5
Vit. B5
Vitamin B6
Vit. B6
Vitamin B12
Vit. B12
Vitamin K
Vit. K
Folate
Folate
203%
0%
16%
6%
5.8%
6.2%
6.7%
11%
8.8%
0%
6.5%
28%
All nutrients comparison - raw data values
Nutrient
DV% diff.
Saturated fat
15.259g
0.081g
69%
Vitamin C
0mg
60.9mg
68%
Vitamin B12
1.3µg
0µg
54%
Phosphorus
347mg
10mg
48%
Protein
19.8g
0.47g
39%
Fats
24.26g
0.26g
37%
Calcium
388mg
20mg
37%
Sodium
842mg
8mg
36%
Vitamin B2
0.488mg
0.027mg
35%
Selenium
14.5µg
0.6µg
25%
Cholesterol
72mg
0mg
24%
Vitamin B5
1.364mg
0.191mg
23%
Vitamin A
241µg
47µg
22%
Zinc
2.38mg
0.08mg
21%
Monounsaturated fat
7.023g
0.072g
17%
Vitamin B6
0.227mg
0.038mg
15%
Calories
300kcal
43kcal
13%
Fiber
0g
1.7g
7%
Folate
62µg
37µg
6%
Fructose
3.73g
5%
Polyunsaturated fat
0.724g
0.058g
4%
Carbs
0.46g
10.82g
3%
Copper
0.021mg
0.045mg
3%
Vitamin D*
18 IU
0 IU
2%
Vitamin D
0.4µg
0µg
2%
Vitamin B3
0.63mg
0.357mg
2%
Choline
15.4mg
6.1mg
2%
Iron
0.33mg
0.25mg
1%
Vitamin E
0.21mg
0.3mg
1%
Vitamin K
2µg
2.6µg
1%
Protein per 100 calories
6.6g
1.1g
N/A
Calories per 10 g protein
152kcal
915kcal
N/A
Weight per 100 calories
33g
233g
N/A
Unsaturated / Saturated Fat ratio
0.51
1.6
N/A
Net carbs
0.46g
9.12g
N/A
Magnesium
20mg
21mg
0%
Potassium
187mg
182mg
0%
Sugar
0.46g
7.82g
N/A
Manganese
0.038mg
0.04mg
0%
Vitamin B1
0.028mg
0.023mg
0%
Tryptophan
0.307mg
0.008mg
0%
Threonine
0.717mg
0.011mg
0%
Isoleucine
0.968mg
0.008mg
0%
Leucine
1.84mg
0.016mg
0%
Lysine
1.766mg
0.025mg
0%
Methionine
0.565mg
0.002mg
0%
Phenylalanine
1.105mg
0.009mg
0%
Valine
1.279mg
0.01mg
0%
Histidine
0.683mg
0.005mg
0%
Macronutrient Comparison
Macronutrient breakdown side-by-side comparison
3
20%
24%
52%
4%
Protein:
19.8 g
Fats:
24.26 g
Carbs:
0.46 g
Water:
51.8 g
Other:
3.68 g
2
11%
88%
Protein:
0.47 g
Fats:
0.26 g
Carbs:
10.82 g
Water:
88.06 g
Other:
0.39 g
Contains
more
Protein Protein
+4112.8%
Contains
more
Fats Fats
+9230.8%
Contains
more
Other Other
+843.6%
Contains
more
Carbs Carbs
+2252.2%
Contains
more
Water Water
+70%
Fat Type Comparison
Fat type breakdown side-by-side comparison
2
66%
31%
3%
Saturated fat:
Sat. Fat
15.259 g
Monounsaturated fat:
Mono. Fat
7.023 g
Polyunsaturated fat:
Poly. Fat
0.724 g
1
38%
34%
27%
Saturated fat:
Sat. Fat
0.081 g
Monounsaturated fat:
Mono. Fat
0.072 g
Polyunsaturated fat:
Poly. Fat
0.058 g
Contains
more
Mono. Fat Monounsaturated fat
+9654.2%
Contains
more
Poly. Fat Polyunsaturated fat
+1148.3%
Contains
less
Sat. Fat Saturated fat
-99.5%