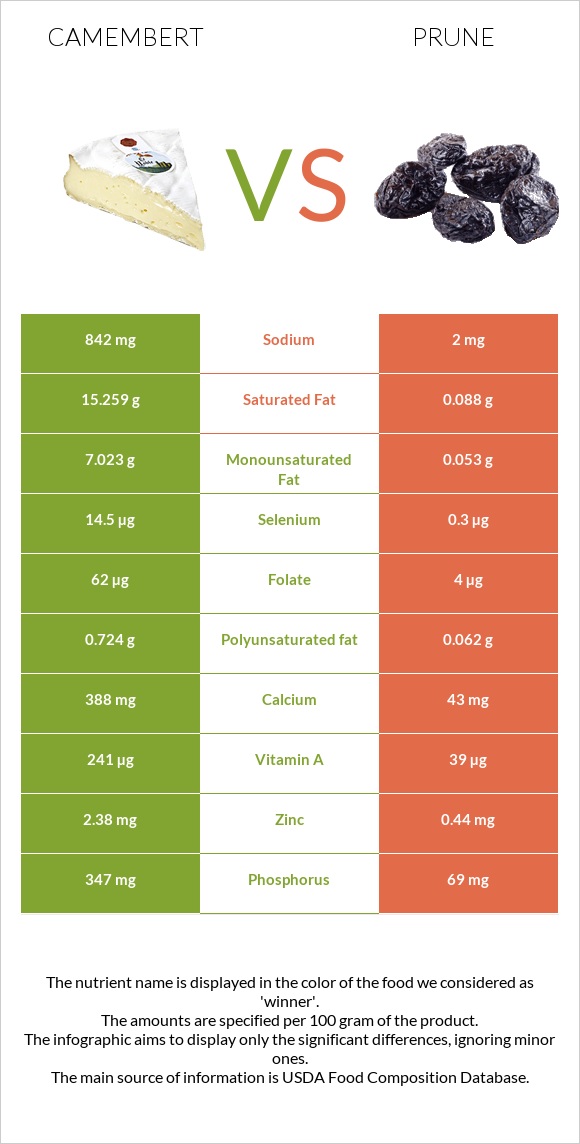
How are camembert and prunes different? Camembert is richer in vitamin B12, phosphorus, calcium, and selenium, while prunes are higher in vitamin K, copper, and fiber. Camembert covers your daily need for saturated fat, 76% more than prunes. Prunes are lower in cholesterol. Cheese, camembert and Plums, dried (prunes), uncooked types were used in this article.
Infographic
Mineral Comparison
Mineral comparison score is based on the number of minerals by which one or the other food is richer. The "coverage" charts below show how much of the daily needs can be covered by 300 grams of the food.
4
100 g
300 g
1 cubic inch - 17g 1 oz - 28.35g 1 wedge (1.33 oz) - 38g 1 cup - 246g
Magnesium
Magnesium
Calcium
Calcium
Potassium
Potassium
Iron
Iron
Copper
Copper
Zinc
Zinc
Phosphorus
Phosphorus
Sodium
Sodium
Manganese
Manganese
Selenium
Selenium
14%
116%
17%
12%
7%
65%
149%
110%
5%
79%
6
100 g
300 g
1 prune, pitted - 9.5g 1 cup, pitted - 174g
Magnesium
Magnesium
Calcium
Calcium
Potassium
Potassium
Iron
Iron
Copper
Copper
Zinc
Zinc
Phosphorus
Phosphorus
Sodium
Sodium
Manganese
Manganese
Selenium
Selenium
29%
13%
65%
35%
94%
12%
30%
0.26%
39%
1.6%
Vitamin Comparison
Vitamin comparison score is based on the number of vitamins by which one or the other food is richer. The "coverage" charts below show how much of the daily needs can be covered by 300 grams of the food.
6
100 g
300 g
1 cubic inch - 17g 1 oz - 28.35g 1 wedge (1.33 oz) - 38g 1 cup - 246g
Vitamin C
Vit. C
Vitamin D
Vit. D
Vitamin A
Vit. A
Vitamin E
Vit. E
Vitamin B1
Vit. B1
Vitamin B2
Vit. B2
Vitamin B3
Vit. B3
Vitamin B5
Vit. B5
Vitamin B6
Vit. B6
Vitamin B12
Vit. B12
Vitamin K
Vit. K
Folate
Folate
0%
6%
80%
4.2%
7%
113%
12%
82%
52%
163%
5%
47%
5
100 g
300 g
1 prune, pitted - 9.5g 1 cup, pitted - 174g
Vitamin C
Vit. C
Vitamin D
Vit. D
Vitamin A
Vit. A
Vitamin E
Vit. E
Vitamin B1
Vit. B1
Vitamin B2
Vit. B2
Vitamin B3
Vit. B3
Vitamin B5
Vit. B5
Vitamin B6
Vit. B6
Vitamin B12
Vit. B12
Vitamin K
Vit. K
Folate
Folate
2%
0%
13%
8.6%
13%
43%
35%
25%
47%
0%
149%
3%
All nutrients comparison - raw data values
Nutrient
DV% diff.
Saturated fat
15.259g
0.088g
69%
Vitamin B12
1.3µg
0µg
54%
Vitamin K
2µg
59.5µg
48%
Phosphorus
347mg
69mg
40%
Fats
24.26g
0.38g
37%
Sodium
842mg
2mg
37%
Protein
19.8g
2.18g
35%
Calcium
388mg
43mg
35%
Copper
0.021mg
0.281mg
29%
Fiber
0g
7.1g
28%
Selenium
14.5µg
0.3µg
26%
Cholesterol
72mg
0mg
24%
Vitamin B2
0.488mg
0.186mg
23%
Vitamin A
241µg
39µg
22%
Carbs
0.46g
63.88g
21%
Vitamin B5
1.364mg
0.422mg
19%
Zinc
2.38mg
0.44mg
18%
Monounsaturated fat
7.023g
0.053g
17%
Potassium
187mg
732mg
16%
Fructose
12.45g
16%
Folate
62µg
4µg
15%
Manganese
0.038mg
0.299mg
11%
Iron
0.33mg
0.93mg
8%
Vitamin B3
0.63mg
1.882mg
8%
Magnesium
20mg
41mg
5%
Polyunsaturated fat
0.724g
0.062g
4%
Calories
300kcal
240kcal
3%
Vitamin D*
18 IU
0 IU
2%
Vitamin D
0.4µg
0µg
2%
Starch
5.11g
2%
Vitamin B1
0.028mg
0.051mg
2%
Vitamin B6
0.227mg
0.205mg
2%
Vitamin C
0mg
0.6mg
1%
Vitamin E
0.21mg
0.43mg
1%
Choline
15.4mg
10.1mg
1%
Protein per 100 calories
6.6g
0.91g
N/A
Calories per 10 g protein
152kcal
1101kcal
N/A
Weight per 100 calories
33g
42g
N/A
Unsaturated / Saturated Fat ratio
0.51
1.3
N/A
Net carbs
0.46g
56.78g
N/A
Sugar
0.46g
38.13g
N/A
Tryptophan
0.307mg
0.025mg
0%
Threonine
0.717mg
0.049mg
0%
Isoleucine
0.968mg
0.041mg
0%
Leucine
1.84mg
0.066mg
0%
Lysine
1.766mg
0.05mg
0%
Methionine
0.565mg
0.016mg
0%
Phenylalanine
1.105mg
0.052mg
0%
Valine
1.279mg
0.056mg
0%
Histidine
0.683mg
0.027mg
0%
Macronutrient Comparison
Macronutrient breakdown side-by-side comparison
4
20%
24%
52%
4%
Protein:
19.8 g
Fats:
24.26 g
Carbs:
0.46 g
Water:
51.8 g
Other:
3.68 g
1
2%
64%
31%
3%
Protein:
2.18 g
Fats:
0.38 g
Carbs:
63.88 g
Water:
30.92 g
Other:
2.64 g
Contains
more
Protein Protein
+808.3%
Contains
more
Fats Fats
+6284.2%
Contains
more
Water Water
+67.5%
Contains
more
Other Other
+39.4%
Contains
more
Carbs Carbs
+13787%
Fat Type Comparison
Fat type breakdown side-by-side comparison
2
66%
31%
3%
Saturated fat:
Sat. Fat
15.259 g
Monounsaturated fat:
Mono. Fat
7.023 g
Polyunsaturated fat:
Poly. Fat
0.724 g
1
43%
26%
31%
Saturated fat:
Sat. Fat
0.088 g
Monounsaturated fat:
Mono. Fat
0.053 g
Polyunsaturated fat:
Poly. Fat
0.062 g
Contains
more
Mono. Fat Monounsaturated fat
+13150.9%
Contains
more
Poly. Fat Polyunsaturated fat
+1067.7%
Contains
less
Sat. Fat Saturated fat
-99.4%