Significant differences between camembert and turmeric Camembert has more vitamin B12; however, turmeric is richer in manganese, iron, copper, fiber, potassium, magnesium, and vitamin E. Turmeric covers your daily manganese needs 859% more than camembert. Turmeric contains less sodium. Camembert has a higher glycemic index. The glycemic index of camembert is 27, while the glycemic index of turmeric is 0. Specific food types used in this comparison are Cheese, camembert and Spices, turmeric, ground .
Infographic
Mineral Comparison
Mineral comparison score is based on the number of minerals by which one or the other food is richer. The "coverage" charts below show how much of the daily needs can be covered by 300 grams of the food.
3
100 g
300 g
1 cubic inch - 17g 1 oz - 28.35g 1 wedge (1.33 oz) - 38g 1 cup - 246g
Magnesium
Magnesium
Calcium
Calcium
Potassium
Potassium
Iron
Iron
Copper
Copper
Zinc
Zinc
Phosphorus
Phosphorus
Sodium
Sodium
Manganese
Manganese
Selenium
Selenium
14%
116%
17%
12%
7%
65%
149%
110%
5%
79%
7
100 g
300 g
0.25 tsp - 0.5g 1 tbsp - 9.4g
Magnesium
Magnesium
Calcium
Calcium
Potassium
Potassium
Iron
Iron
Copper
Copper
Zinc
Zinc
Phosphorus
Phosphorus
Sodium
Sodium
Manganese
Manganese
Selenium
Selenium
149%
50%
184%
2063%
433%
123%
128%
3.5%
2583%
34%
Vitamin Comparison
Vitamin comparison score is based on the number of vitamins by which one or the other food is richer. The "coverage" charts below show how much of the daily needs can be covered by 300 grams of the food.
7
100 g
300 g
1 cubic inch - 17g 1 oz - 28.35g 1 wedge (1.33 oz) - 38g 1 cup - 246g
Vitamin C
Vit. C
Vitamin D
Vit. D
Vitamin A
Vit. A
Vitamin E
Vit. E
Vitamin B1
Vit. B1
Vitamin B2
Vit. B2
Vitamin B3
Vit. B3
Vitamin B5
Vit. B5
Vitamin B6
Vit. B6
Vitamin B12
Vit. B12
Vitamin K
Vit. K
Folate
Folate
0%
6%
80%
4.2%
7%
113%
12%
82%
52%
163%
5%
47%
5
100 g
300 g
0.25 tsp - 0.5g 1 tbsp - 9.4g
Vitamin C
Vit. C
Vitamin D
Vit. D
Vitamin A
Vit. A
Vitamin E
Vit. E
Vitamin B1
Vit. B1
Vitamin B2
Vit. B2
Vitamin B3
Vit. B3
Vitamin B5
Vit. B5
Vitamin B6
Vit. B6
Vitamin B12
Vit. B12
Vitamin K
Vit. K
Folate
Folate
2.3%
0%
0%
89%
15%
35%
25%
33%
25%
0%
34%
15%
All nutrients comparison - raw data values
Nutrient
DV% diff.
Manganese
0.038mg
19.8mg
859%
Iron
0.33mg
55mg
683%
Copper
0.021mg
1.3mg
142%
Fiber
0g
22.7g
91%
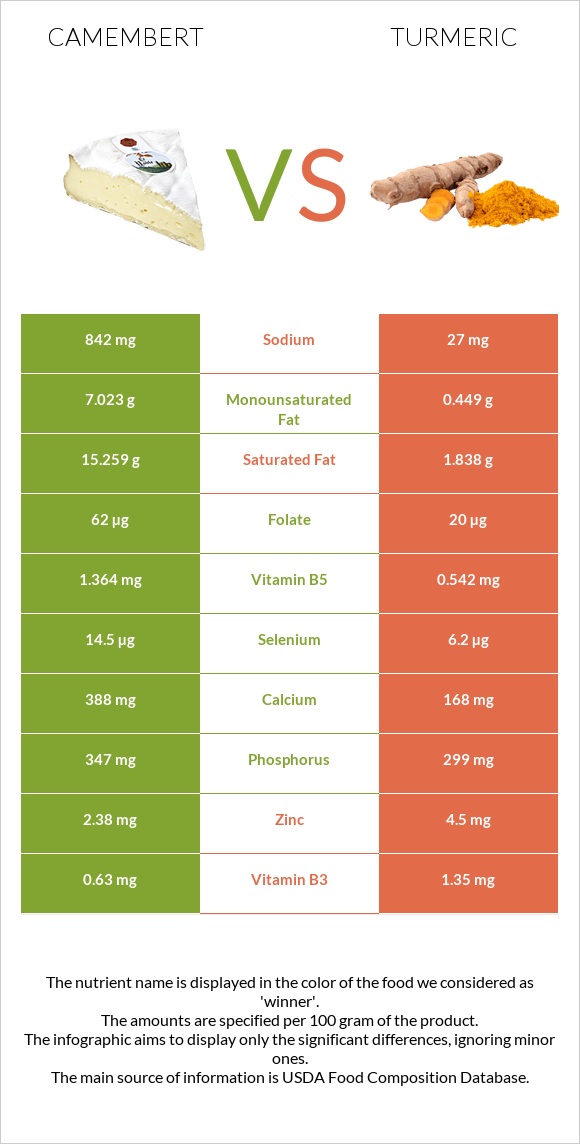
Saturated fat
15.259g
1.838g
61%
Potassium
187mg
2080mg
56%
Vitamin B12
1.3µg
0µg
54%
Magnesium
20mg
208mg
45%
Sodium
842mg
27mg
35%
Fats
24.26g
3.25g
32%
Vitamin E
0.21mg
4.43mg
28%
Vitamin A
241µg
0µg
27%
Vitamin B2
0.488mg
0.15mg
26%
Cholesterol
72mg
0mg
24%
Carbs
0.46g
67.14g
22%
Calcium
388mg
168mg
22%
Protein
19.8g
9.68g
20%
Zinc
2.38mg
4.5mg
19%
Vitamin B5
1.364mg
0.542mg
16%
Monounsaturated fat
7.023g
0.449g
16%
Selenium
14.5µg
6.2µg
15%
Folate
62µg
20µg
11%
Vitamin K
2µg
13.4µg
10%
Vitamin B6
0.227mg
0.107mg
9%
Phosphorus
347mg
299mg
7%
Choline
15.4mg
49.2mg
6%
Vitamin B3
0.63mg
1.35mg
5%
Vitamin B1
0.028mg
0.058mg
3%
Vitamin D*
18 IU
0 IU
2%
Vitamin D
0.4µg
0µg
2%
Calories
300kcal
312kcal
1%
Vitamin C
0mg
0.7mg
1%
Fructose
0.45g
1%
Protein per 100 calories
6.6g
3.1g
N/A
Calories per 10 g protein
152kcal
322kcal
N/A
Weight per 100 calories
33g
32g
N/A
Unsaturated / Saturated Fat ratio
0.51
0.66
N/A
Net carbs
0.46g
44.44g
N/A
Sugar
0.46g
3.21g
N/A
Trans fat
0.056g
N/A
Polyunsaturated fat
0.724g
0.756g
0%
Tryptophan
0.307mg
0.17mg
0%
Threonine
0.717mg
0.33mg
0%
Isoleucine
0.968mg
0.47mg
0%
Leucine
1.84mg
0.81mg
0%
Lysine
1.766mg
0.38mg
0%
Methionine
0.565mg
0.14mg
0%
Phenylalanine
1.105mg
0.53mg
0%
Valine
1.279mg
0.66mg
0%
Histidine
0.683mg
0.15mg
0%
Omega-3 - ALA
0.003g
N/A
Omega-6 - Gamma-linoleic acid
0.081g
N/A
Macronutrient Comparison
Macronutrient breakdown side-by-side comparison
3
20%
24%
52%
4%
Protein:
19.8 g
Fats:
24.26 g
Carbs:
0.46 g
Water:
51.8 g
Other:
3.68 g
2
10%
3%
67%
13%
7%
Protein:
9.68 g
Fats:
3.25 g
Carbs:
67.14 g
Water:
12.85 g
Other:
7.08 g
Contains
more
Protein Protein
+104.5%
Contains
more
Fats Fats
+646.5%
Contains
more
Water Water
+303.1%
Contains
more
Carbs Carbs
+14495.7%
Contains
more
Other Other
+92.4%
Fat Type Comparison
Fat type breakdown side-by-side comparison
1
66%
31%
3%
Saturated fat:
Sat. Fat
15.259 g
Monounsaturated fat:
Mono. Fat
7.023 g
Polyunsaturated fat:
Poly. Fat
0.724 g
2
60%
15%
25%
Saturated fat:
Sat. Fat
1.838 g
Monounsaturated fat:
Mono. Fat
0.449 g
Polyunsaturated fat:
Poly. Fat
0.756 g
Contains
more
Mono. Fat Monounsaturated fat
+1464.1%
Contains
less
Sat. Fat Saturated fat
-88%
~equal in
Polyunsaturated fat
~0.756g