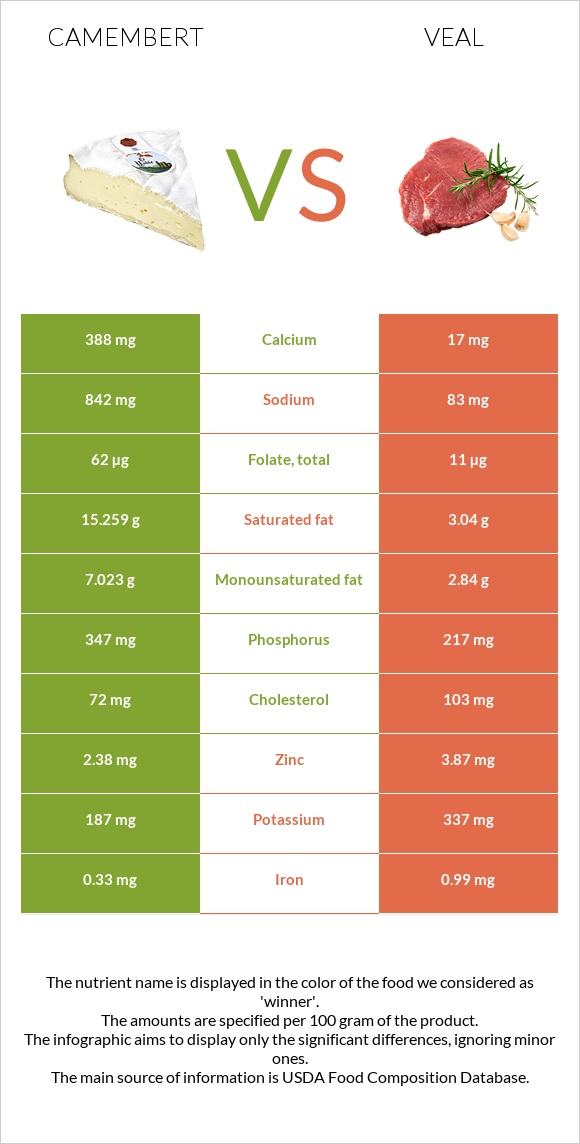
Significant differences between camembert and veal Camembert has more calcium, phosphorus, vitamin B2, vitamin A, and folate; however, veal is richer in vitamin B3, choline, and zinc. Camembert covers your daily saturated fat needs 61% more than veal. Veal contains less sodium. Camembert has a higher glycemic index. The glycemic index of camembert is 27, while the glycemic index of veal is 0. Specific food types used in this comparison are Cheese, camembert and Veal, ground, cooked, broiled .
Infographic
Mineral Comparison
Mineral comparison score is based on the number of minerals by which one or the other food is richer. The "coverage" charts below show how much of the daily needs can be covered by 300 grams of the food.
2
100 g
300 g
1 cubic inch - 17g 1 oz - 28.35g 1 wedge (1.33 oz) - 38g 1 cup - 246g
Magnesium
Magnesium
Calcium
Calcium
Potassium
Potassium
Iron
Iron
Copper
Copper
Zinc
Zinc
Phosphorus
Phosphorus
Sodium
Sodium
Manganese
Manganese
Selenium
Selenium
14%
116%
17%
12%
7%
65%
149%
110%
5%
79%
6
100 g
300 g
3 oz - 85g 1 unit, cooked (yield from 1 lb raw meat) - 299g
Magnesium
Magnesium
Calcium
Calcium
Potassium
Potassium
Iron
Iron
Copper
Copper
Zinc
Zinc
Phosphorus
Phosphorus
Sodium
Sodium
Manganese
Manganese
Selenium
Selenium
17%
5.1%
30%
37%
34%
106%
93%
11%
4.6%
75%
Vitamin Comparison
Vitamin comparison score is based on the number of vitamins by which one or the other food is richer. The "coverage" charts below show how much of the daily needs can be covered by 300 grams of the food.
7
100 g
300 g
1 cubic inch - 17g 1 oz - 28.35g 1 wedge (1.33 oz) - 38g 1 cup - 246g
Vitamin C
Vit. C
Vitamin D
Vit. D
Vitamin A
Vit. A
Vitamin E
Vit. E
Vitamin B1
Vit. B1
Vitamin B2
Vit. B2
Vitamin B3
Vit. B3
Vitamin B5
Vit. B5
Vitamin B6
Vit. B6
Vitamin B12
Vit. B12
Vitamin K
Vit. K
Folate
Folate
0%
6%
80%
4.2%
7%
113%
12%
82%
52%
163%
5%
47%
3
100 g
300 g
3 oz - 85g 1 unit, cooked (yield from 1 lb raw meat) - 299g
Vitamin C
Vit. C
Vitamin D
Vit. D
Vitamin A
Vit. A
Vitamin E
Vit. E
Vitamin B1
Vit. B1
Vitamin B2
Vit. B2
Vitamin B3
Vit. B3
Vitamin B5
Vit. B5
Vitamin B6
Vit. B6
Vitamin B12
Vit. B12
Vitamin K
Vit. K
Folate
Folate
0%
0%
0%
3%
18%
62%
151%
70%
90%
159%
3%
8.3%
All nutrients comparison - raw data values
Nutrient
DV% diff.
Saturated fat
15.259g
3.04g
56%
Vitamin B3
0.63mg
8.03mg
46%
Calcium
388mg
17mg
37%
Sodium
842mg
83mg
33%
Vitamin A
241µg
0µg
27%
Fats
24.26g
7.56g
26%
Phosphorus
347mg
217mg
19%
Vitamin B2
0.488mg
0.27mg
17%
Zinc
2.38mg
3.87mg
14%
Choline
15.4mg
95mg
14%
Vitamin B6
0.227mg
0.39mg
13%
Folate
62µg
11µg
13%
Cholesterol
72mg
103mg
10%
Monounsaturated fat
7.023g
2.84g
10%
Protein
19.8g
24.38g
9%
Copper
0.021mg
0.103mg
9%
Iron
0.33mg
0.99mg
8%
Calories
300kcal
172kcal
6%
Potassium
187mg
337mg
4%
Vitamin B1
0.028mg
0.07mg
4%
Vitamin B5
1.364mg
1.16mg
4%
Vitamin D*
18 IU
0 IU
2%
Vitamin D
0.4µg
0µg
2%
Magnesium
20mg
24mg
1%
Selenium
14.5µg
13.7µg
1%
Vitamin B12
1.3µg
1.27µg
1%
Vitamin K
2µg
1.2µg
1%
Polyunsaturated fat
0.724g
0.55g
1%
Protein per 100 calories
6.6g
14g
N/A
Calories per 10 g protein
152kcal
71kcal
N/A
Weight per 100 calories
33g
58g
N/A
Unsaturated / Saturated Fat ratio
0.51
1.1
N/A
Net carbs
0.46g
0g
N/A
Carbs
0.46g
0g
0%
Sugar
0.46g
0g
N/A
Vitamin E
0.21mg
0.15mg
0%
Manganese
0.038mg
0.035mg
0%
Tryptophan
0.307mg
0.247mg
0%
Threonine
0.717mg
1.065mg
0%
Isoleucine
0.968mg
1.201mg
0%
Leucine
1.84mg
1.94mg
0%
Lysine
1.766mg
2.009mg
0%
Methionine
0.565mg
0.569mg
0%
Phenylalanine
1.105mg
0.984mg
0%
Valine
1.279mg
1.347mg
0%
Histidine
0.683mg
0.885mg
0%
Macronutrient Comparison
Macronutrient breakdown side-by-side comparison
3
20%
24%
52%
4%
Protein:
19.8 g
Fats:
24.26 g
Carbs:
0.46 g
Water:
51.8 g
Other:
3.68 g
2
24%
8%
67%
Protein:
24.38 g
Fats:
7.56 g
Carbs:
0 g
Water:
66.76 g
Other:
1.3 g
Contains
more
Fats Fats
+220.9%
Contains
more
Carbs Carbs
+∞%
Contains
more
Other Other
+183.1%
Contains
more
Protein Protein
+23.1%
Contains
more
Water Water
+28.9%
Fat Type Comparison
Fat type breakdown side-by-side comparison
2
66%
31%
3%
Saturated fat:
Sat. Fat
15.259 g
Monounsaturated fat:
Mono. Fat
7.023 g
Polyunsaturated fat:
Poly. Fat
0.724 g
1
47%
44%
9%
Saturated fat:
Sat. Fat
3.04 g
Monounsaturated fat:
Mono. Fat
2.84 g
Polyunsaturated fat:
Poly. Fat
0.55 g
Contains
more
Mono. Fat Monounsaturated fat
+147.3%
Contains
more
Poly. Fat Polyunsaturated fat
+31.6%
Contains
less
Sat. Fat Saturated fat
-80.1%