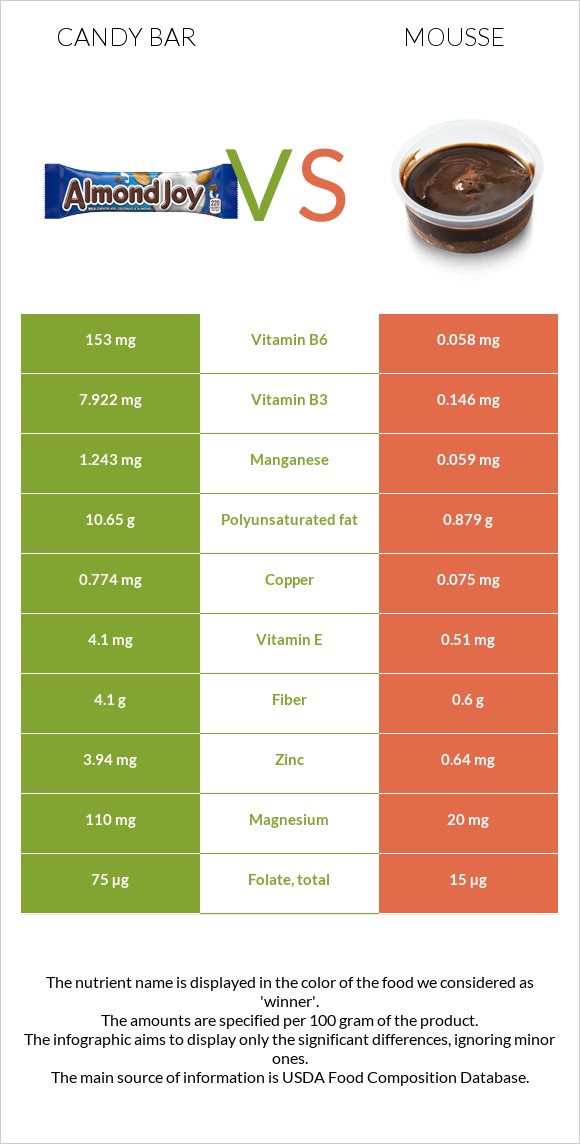
How are candy bar and mousse different? Candy bar has more vitamin B6, copper, manganese, vitamin B3, zinc, phosphorus, vitamin E, and magnesium than mousse. Daily need coverage for vitamin B6 for candy bar is 11765% higher. Candy bar contains 54 times more vitamin B3 than mousse. While candy bar contains 7.922mg of vitamin B3, mousse contains only 0.146mg. Candy bar has less saturated fat. Candies, peanut bar and Desserts, mousse, chocolate, prepared-from-recipe are the varieties used in this article.
Infographic
Mineral Comparison
Mineral comparison score is based on the number of minerals by which one or the other food is richer. The "coverage" charts below show how much of the daily needs can be covered by 300 grams of the food.
7
100 g
300 g
1 oz - 28.35g 1 bar (1.4 oz) - 40g 1 bar (1.6 oz) - 45g 1 bar (1.75 fl oz) - 50g
Magnesium
Magnesium
Calcium
Calcium
Potassium
Potassium
Iron
Iron
Copper
Copper
Zinc
Zinc
Phosphorus
Phosphorus
Sodium
Sodium
Manganese
Manganese
Selenium
Selenium
79%
23%
36%
36%
258%
107%
132%
20%
162%
26%
3
100 g
300 g
0.5 cup - 202g 1 recipe yield - 808g
Magnesium
Magnesium
Calcium
Calcium
Potassium
Potassium
Iron
Iron
Copper
Copper
Zinc
Zinc
Phosphorus
Phosphorus
Sodium
Sodium
Manganese
Manganese
Selenium
Selenium
14%
29%
13%
21%
25%
17%
50%
5%
7.7%
40%
Vitamin Comparison
Vitamin comparison score is based on the number of vitamins by which one or the other food is richer. The "coverage" charts below show how much of the daily needs can be covered by 300 grams of the food.
6
100 g
300 g
1 oz - 28.35g 1 bar (1.4 oz) - 40g 1 bar (1.6 oz) - 45g 1 bar (1.75 fl oz) - 50g
Vitamin C
Vit. C
Vitamin D
Vit. D
Vitamin A
Vit. A
Vitamin E
Vit. E
Vitamin B1
Vit. B1
Vitamin B2
Vit. B2
Vitamin B3
Vit. B3
Vitamin B5
Vit. B5
Vitamin B6
Vit. B6
Vitamin B12
Vit. B12
Vitamin K
Vit. K
Folate
Folate
0%
0%
0%
82%
25%
32%
149%
50%
35308%
0%
0%
56%
5
100 g
300 g
0.5 cup - 202g 1 recipe yield - 808g
Vitamin C
Vit. C
Vitamin D
Vit. D
Vitamin A
Vit. A
Vitamin E
Vit. E
Vitamin B1
Vit. B1
Vitamin B2
Vit. B2
Vitamin B3
Vit. B3
Vitamin B5
Vit. B5
Vitamin B6
Vit. B6
Vitamin B12
Vit. B12
Vitamin K
Vit. K
Folate
Folate
0.33%
0%
47%
10%
11%
47%
2.7%
32%
13%
59%
4%
11%
All nutrients comparison - raw data values
Nutrient
DV% diff.
Vitamin B6
153mg
0.058mg
11765%
Copper
0.774mg
0.075mg
78%
Polyunsaturated fat
10.65g
0.879g
65%
Manganese
1.243mg
0.059mg
51%
Vitamin B3
7.922mg
0.146mg
49%
Cholesterol
0mg
140mg
47%
Zinc
3.94mg
0.64mg
30%
Monounsaturated fat
16.721g
5.027g
29%
Fats
33.7g
16g
27%
Phosphorus
308mg
117mg
27%
Vitamin E
4.1mg
0.51mg
24%
Protein
15.5g
4.14g
23%
Magnesium
110mg
20mg
21%
Vitamin B12
0µg
0.47µg
20%
Saturated fat
4.678g
9.151g
20%
Vitamin A
0µg
140µg
16%
Calories
522kcal
225kcal
15%
Folate
75µg
15µg
15%
Fiber
4.1g
0.6g
14%
Carbs
47.4g
16.07g
10%
Potassium
407mg
143mg
8%
Vitamin B5
0.83mg
0.533mg
6%
Iron
0.97mg
0.55mg
5%
Sodium
156mg
38mg
5%
Selenium
4.7µg
7.4µg
5%
Vitamin B1
0.1mg
0.045mg
5%
Vitamin B2
0.14mg
0.205mg
5%
Choline
29.4mg
5%
Calcium
78mg
96mg
2%
Caffeine
0mg
7mg
2%
Vitamin K
0µg
1.6µg
1%
Protein per 100 calories
3g
1.8g
N/A
Calories per 10 g protein
337kcal
543kcal
N/A
Weight per 100 calories
19g
44g
N/A
Unsaturated / Saturated Fat ratio
5.9
0.65
N/A
Vitamin C
0mg
0.1mg
0%
Net carbs
43.3g
15.47g
N/A
Sugar
42.22g
14.81g
N/A
Tryptophan
0.149mg
0%
Threonine
0.52mg
0%
Isoleucine
0.534mg
0%
Leucine
0.986mg
0%
Lysine
0.545mg
0%
Methionine
0.185mg
0%
Phenylalanine
0.787mg
0%
Valine
0.638mg
0%
Histidine
0.385mg
0%
Omega-3 - EPA
0g
0.001g
N/A
Omega-3 - DHA
0g
0.01g
N/A
Macronutrient Comparison
Macronutrient breakdown side-by-side comparison
4
16%
34%
47%
2%
Protein:
15.5 g
Fats:
33.7 g
Carbs:
47.4 g
Water:
1.6 g
Other:
1.8 g
1
4%
16%
16%
63%
Protein:
4.14 g
Fats:
16 g
Carbs:
16.07 g
Water:
62.94 g
Other:
0.85 g
Contains
more
Protein Protein
+274.4%
Contains
more
Fats Fats
+110.6%
Contains
more
Carbs Carbs
+195%
Contains
more
Other Other
+111.8%
Contains
more
Water Water
+3833.8%
Fat Type Comparison
Fat type breakdown side-by-side comparison
3
15%
52%
33%
Saturated fat:
Sat. Fat
4.678 g
Monounsaturated fat:
Mono. Fat
16.721 g
Polyunsaturated fat:
Poly. Fat
10.65 g
0
61%
33%
6%
Saturated fat:
Sat. Fat
9.151 g
Monounsaturated fat:
Mono. Fat
5.027 g
Polyunsaturated fat:
Poly. Fat
0.879 g
Contains
less
Sat. Fat Saturated fat
-48.9%
Contains
more
Mono. Fat Monounsaturated fat
+232.6%
Contains
more
Poly. Fat Polyunsaturated fat
+1111.6%