Caper vs. Penne — In-Depth Nutrition Comparison
Compare
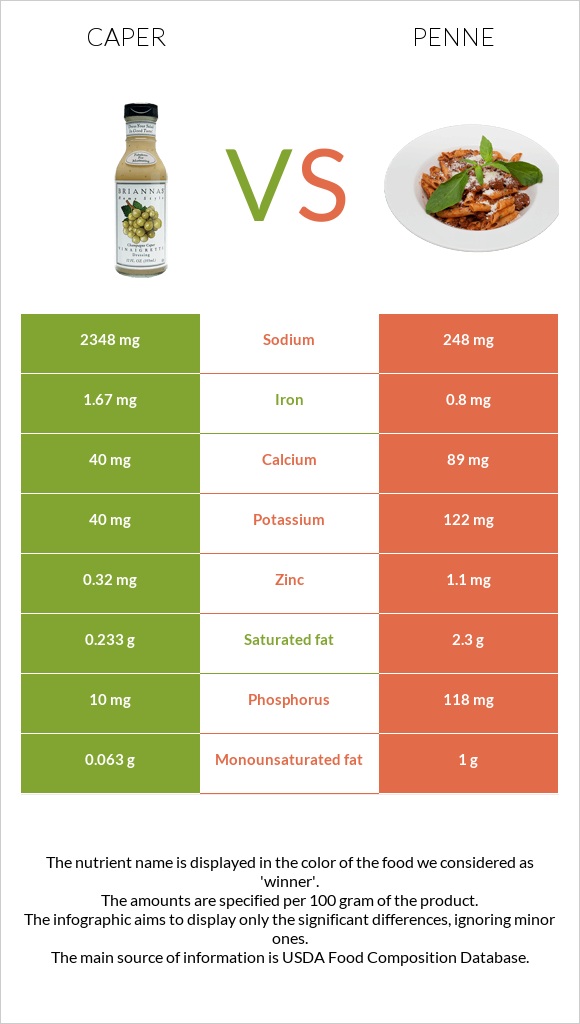
Significant differences between caper and penne
- Caper has more iron; however, penne is richer in phosphorus, zinc, and monounsaturated fat.
- Caper covers your daily sodium needs 91% more than penne.
- Penne has 2 times less iron than caper. Caper has 1.67mg of iron, while penne has 0.8mg.
- Penne contains less sodium.
Specific food types used in this comparison are Capers, canned and KASHI Three Cheese Penne, frozen, unprepared.
Infographic
Infographic link
Mineral Comparison
Mineral comparison score is based on the number of minerals by which one or the other food is richer. The "coverage" charts below show how much of the daily needs can be covered by 300 grams of the food.
| Contains more IronIron | +108.8% |
| Contains more CopperCopper | +∞% |
| Contains more ManganeseManganese | +∞% |
| Contains more SeleniumSelenium | +∞% |
| Contains more CalciumCalcium | +122.5% |
| Contains more PotassiumPotassium | +205% |
| Contains more ZincZinc | +243.8% |
| Contains more PhosphorusPhosphorus | +1080% |
| Contains less SodiumSodium | -89.4% |
Vitamin Comparison
Vitamin comparison score is based on the number of vitamins by which one or the other food is richer. The "coverage" charts below show how much of the daily needs can be covered by 300 grams of the food.
| Contains more Vitamin CVitamin C | +∞% |
| Contains more Vitamin AVitamin A | +∞% |
| Contains more Vitamin EVitamin E | +∞% |
| Contains more Vitamin B1Vitamin B1 | +∞% |
| Contains more Vitamin B2Vitamin B2 | +∞% |
| Contains more Vitamin B3Vitamin B3 | +∞% |
| Contains more Vitamin B5Vitamin B5 | +∞% |
| Contains more Vitamin B6Vitamin B6 | +∞% |
| Contains more Vitamin KVitamin K | +∞% |
| Contains more FolateFolate | +∞% |
All nutrients comparison - raw data values
| Nutrient |  |
 |
DV% diff. |
| Sodium | 2348mg | 248mg | 91% |
| Copper | 0.374mg | 42% | |
| Vitamin K | 24.6µg | 21% | |
| Phosphorus | 10mg | 118mg | 15% |
| Iron | 1.67mg | 0.8mg | 11% |
| Vitamin B2 | 0.139mg | 11% | |
| Saturated fat | 0.233g | 2.3g | 9% |
| Protein | 2.36g | 5.7g | 7% |
| Zinc | 0.32mg | 1.1mg | 7% |
| Vitamin E | 0.88mg | 6% | |
| Folate | 23µg | 6% | |
| Calories | 23kcal | 126kcal | 5% |
| Fats | 0.86g | 4g | 5% |
| Vitamin C | 4.3mg | 0mg | 5% |
| Calcium | 40mg | 89mg | 5% |
| Carbs | 4.89g | 16.8g | 4% |
| Cholesterol | 0mg | 12mg | 4% |
| Vitamin B3 | 0.652mg | 4% | |
| Manganese | 0.078mg | 3% | |
| Potassium | 40mg | 122mg | 2% |
| Fiber | 3.2g | 2.7g | 2% |
| Selenium | 1.2µg | 2% | |
| Vitamin B1 | 0.018mg | 2% | |
| Vitamin B6 | 0.023mg | 2% | |
| Monounsaturated fat | 0.063g | 1g | 2% |
| Magnesium | 33mg | 30mg | 1% |
| Vitamin A | 7µg | 1% | |
| Vitamin B5 | 0.027mg | 1% | |
| Choline | 6.5mg | 1% | |
| Polyunsaturated fat | 0.304g | 0.4g | 1% |
| Net carbs | 1.69g | 14.1g | N/A |
| Sugar | 0.41g | 1.9g | N/A |
| Trans fat | 0g | 0.2g | N/A |
| Omega-3 - DPA | 0.001g | N/A |
Macronutrient Comparison
Macronutrient breakdown side-by-side comparison
| Contains more WaterWater | +15.8% |
| Contains more OtherOther | +630.9% |
| Contains more ProteinProtein | +141.5% |
| Contains more FatsFats | +365.1% |
| Contains more CarbsCarbs | +243.6% |
Fat Type Comparison
Fat type breakdown side-by-side comparison
| Contains less Sat. FatSaturated fat | -89.9% |
| Contains more Mono. FatMonounsaturated fat | +1487.3% |
| Contains more Poly. FatPolyunsaturated fat | +31.6% |


