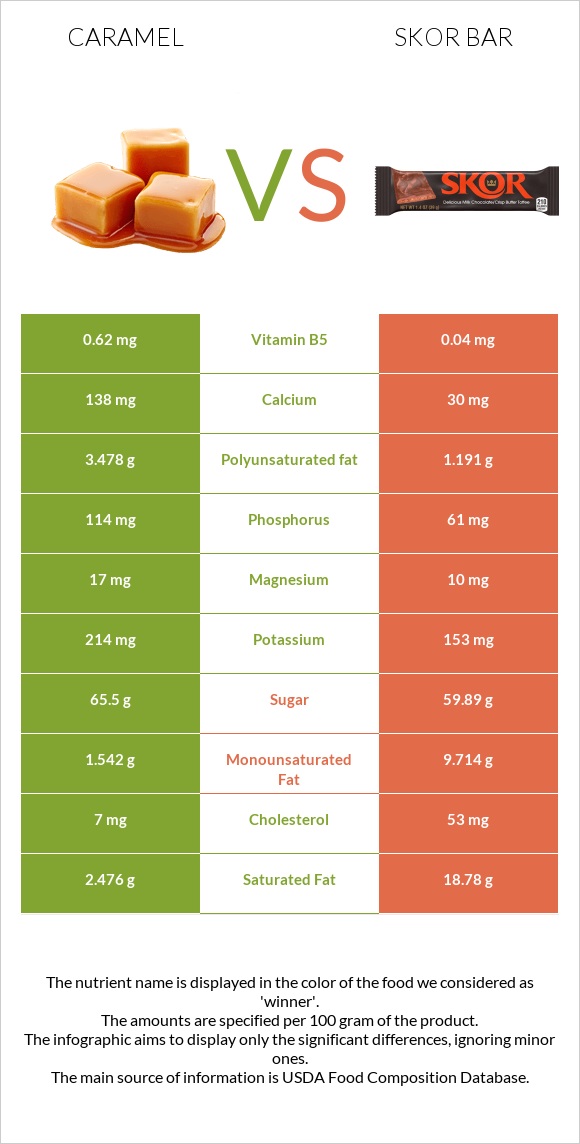
Significant differences between caramel and skor bar Caramel has more vitamin B2, vitamin B5, calcium, phosphorus, and vitamin B1; however, skor bar is richer in vitamin K, iron, and fiber. Skor bar covers your daily saturated fat needs 82% more than caramel. Skor bar has 16 times less vitamin B5 than caramel. Caramel has 0.62mg of vitamin B5, while skor bar has 0.04mg. Caramel contains less cholesterol. Specific food types used in this comparison are Candies, caramels and Candies, HERSHEY'S SKOR Toffee Bar .
Infographic
Mineral Comparison
Mineral comparison score is based on the number of minerals by which one or the other food is richer. The "coverage" charts below show how much of the daily needs can be covered by 300 grams of the food.
8
100 g
300 g
1 piece - 10.1g 1 package (2.5 oz) - 71g
Magnesium
Magnesium
Calcium
Calcium
Potassium
Potassium
Iron
Iron
Copper
Copper
Zinc
Zinc
Phosphorus
Phosphorus
Sodium
Sodium
Manganese
Manganese
Selenium
Selenium
12%
41%
19%
5.3%
6%
12%
49%
32%
1.4%
9.8%
2
100 g
300 g
1 bar 1.4 oz - 39g
Magnesium
Magnesium
Calcium
Calcium
Potassium
Potassium
Iron
Iron
Copper
Copper
Zinc
Zinc
Phosphorus
Phosphorus
Sodium
Sodium
Manganese
Manganese
Selenium
Selenium
7.1%
9%
14%
21%
13%
4.6%
26%
41%
0%
0%
Vitamin Comparison
Vitamin comparison score is based on the number of vitamins by which one or the other food is richer. The "coverage" charts below show how much of the daily needs can be covered by 300 grams of the food.
7
100 g
300 g
1 piece - 10.1g 1 package (2.5 oz) - 71g
Vitamin C
Vit. C
Vitamin D
Vit. D
Vitamin A
Vit. A
Vitamin E
Vit. E
Vitamin B1
Vit. B1
Vitamin B2
Vit. B2
Vitamin B3
Vit. B3
Vitamin B5
Vit. B5
Vitamin B6
Vit. B6
Vitamin B12
Vit. B12
Vitamin K
Vit. K
Folate
Folate
1.3%
0%
4%
9.2%
26%
59%
2.8%
37%
13%
38%
4.5%
3%
5
100 g
300 g
1 bar 1.4 oz - 39g
Vitamin C
Vit. C
Vitamin D
Vit. D
Vitamin A
Vit. A
Vitamin E
Vit. E
Vitamin B1
Vit. B1
Vitamin B2
Vit. B2
Vitamin B3
Vit. B3
Vitamin B5
Vit. B5
Vitamin B6
Vit. B6
Vitamin B12
Vit. B12
Vitamin K
Vit. K
Folate
Folate
1.7%
1.5%
20%
12%
5%
23%
2.4%
2.4%
5.1%
26%
22%
1.5%
All nutrients comparison - raw data values
Nutrient
DV% diff.
Saturated fat
2.476g
18.78g
74%
Fats
8.1g
30.37g
34%
Monounsaturated fat
1.542g
9.714g
20%
Cholesterol
7mg
53mg
15%
Polyunsaturated fat
3.478g
1.191g
15%
Vitamin B2
0.256mg
0.1mg
12%
Vitamin B5
0.62mg
0.04mg
12%
Calcium
138mg
30mg
11%
Calories
382kcal
541kcal
8%
Phosphorus
114mg
61mg
8%
Vitamin B1
0.103mg
0.02mg
7%
Vitamin K
1.8µg
8.6µg
6%
Iron
0.14mg
0.57mg
5%
Fiber
0g
1.3g
5%
Vitamin A
12µg
61µg
5%
Carbs
77g
63.73g
4%
Vitamin B12
0.3µg
0.21µg
4%
Protein
4.6g
3.13g
3%
Sodium
245mg
317mg
3%
Selenium
1.8µg
0µg
3%
Vitamin B6
0.056mg
0.022mg
3%
Caffeine
0mg
10mg
3%
Magnesium
17mg
10mg
2%
Potassium
214mg
153mg
2%
Copper
0.018mg
0.04mg
2%
Zinc
0.44mg
0.17mg
2%
Vitamin D
0µg
0.1µg
1%
Vitamin E
0.46mg
0.58mg
1%
Folate
4µg
2µg
1%
Choline
8mg
3.1mg
1%
Protein per 100 calories
1.2g
0.58g
N/A
Calories per 10 g protein
830kcal
1728kcal
N/A
Weight per 100 calories
26g
18g
N/A
Unsaturated / Saturated Fat ratio
2
0.58
N/A
Vitamin C
0.4mg
0.5mg
0%
Net carbs
77g
62.43g
N/A
Vitamin D*
0 IU
3 IU
0%
Sugar
65.5g
59.89g
N/A
Manganese
0.011mg
0mg
0%
Vitamin B3
0.148mg
0.13mg
0%
Tryptophan
0.06mg
0%
Threonine
0.192mg
0%
Isoleucine
0.258mg
0%
Leucine
0.417mg
0%
Lysine
0.338mg
0%
Methionine
0.107mg
0%
Phenylalanine
0.205mg
0%
Valine
0.285mg
0%
Histidine
0.115mg
0%
Macronutrient Comparison
Macronutrient breakdown side-by-side comparison
4
5%
8%
77%
9%
2%
Protein:
4.6 g
Fats:
8.1 g
Carbs:
77 g
Water:
8.5 g
Other:
1.8 g
1
3%
30%
64%
Protein:
3.13 g
Fats:
30.37 g
Carbs:
63.73 g
Water:
1.57 g
Other:
1.2 g
Contains
more
Protein Protein
+47%
Contains
more
Carbs Carbs
+20.8%
Contains
more
Water Water
+441.4%
Contains
more
Other Other
+50%
Contains
more
Fats Fats
+274.9%
Fat Type Comparison
Fat type breakdown side-by-side comparison
2
33%
21%
46%
Saturated fat:
Sat. Fat
2.476 g
Monounsaturated fat:
Mono. Fat
1.542 g
Polyunsaturated fat:
Poly. Fat
3.478 g
1
63%
33%
4%
Saturated fat:
Sat. Fat
18.78 g
Monounsaturated fat:
Mono. Fat
9.714 g
Polyunsaturated fat:
Poly. Fat
1.191 g
Contains
less
Sat. Fat Saturated fat
-86.8%
Contains
more
Poly. Fat Polyunsaturated fat
+192%
Contains
more
Mono. Fat Monounsaturated fat
+530%