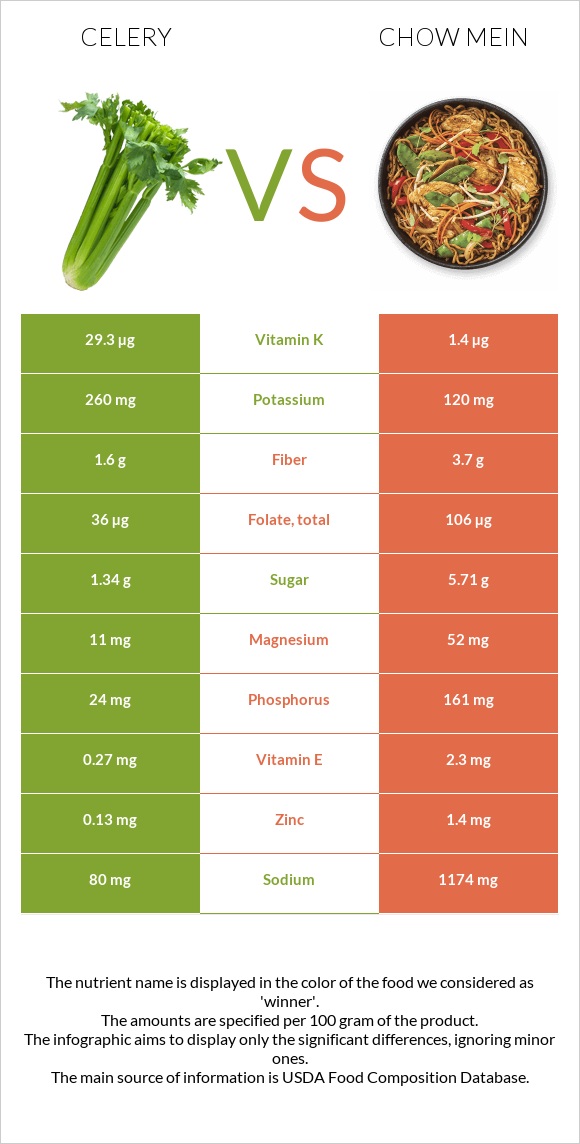
What are the main differences between celery and chow mein? Celery is richer in vitamin K, yet chow mein is richer in selenium, iron, vitamin B1, vitamin B3, vitamin B2, phosphorus, folate, and copper. Chow mein's daily need coverage for selenium is 77% higher. Celery has 21 times more vitamin K than chow mein. Celery has 29.3µg of vitamin K, while chow mein has 1.4µg. Celery contains less sodium. Celery has a lower glycemic index than chow mein. We used Celery, raw and Noodles, chinese, chow mein types in this comparison.
Infographic
Mineral Comparison
Mineral comparison score is based on the number of minerals by which one or the other food is richer. The "coverage" charts below show how much of the daily needs can be covered by 300 grams of the food.
4
100 g
300 g
1 strip (4" long) - 4g 1 tbsp - 7.5g 1 stalk, small (5" long) - 17g 1 stalk, medium (7-1/2" - 8" long) - 40g 1 stalk, large (11"-12" long) - 64g 1 cup chopped - 101g 1 NLEA serving - 110g
Magnesium
Magnesium
Calcium
Calcium
Potassium
Potassium
Iron
Iron
Copper
Copper
Zinc
Zinc
Phosphorus
Phosphorus
Sodium
Sodium
Manganese
Manganese
Selenium
Selenium
7.9%
12%
23%
7.5%
12%
3.5%
10%
10%
13%
2.2%
6
100 g
300 g
0.5 cup dry - 28g 1.5 oz - 43g
Magnesium
Magnesium
Calcium
Calcium
Potassium
Potassium
Iron
Iron
Copper
Copper
Zinc
Zinc
Phosphorus
Phosphorus
Sodium
Sodium
Manganese
Manganese
Selenium
Selenium
37%
6%
11%
177%
56%
38%
69%
153%
0%
235%
Vitamin Comparison
Vitamin comparison score is based on the number of vitamins by which one or the other food is richer. The "coverage" charts below show how much of the daily needs can be covered by 300 grams of the food.
3
100 g
300 g
1 strip (4" long) - 4g 1 tbsp - 7.5g 1 stalk, small (5" long) - 17g 1 stalk, medium (7-1/2" - 8" long) - 40g 1 stalk, large (11"-12" long) - 64g 1 cup chopped - 101g 1 NLEA serving - 110g
Vitamin C
Vit. C
Vitamin D
Vit. D
Vitamin A
Vit. A
Vitamin E
Vit. E
Vitamin B1
Vit. B1
Vitamin B2
Vit. B2
Vitamin B3
Vit. B3
Vitamin B5
Vit. B5
Vitamin B6
Vit. B6
Vitamin B12
Vit. B12
Vitamin K
Vit. K
Folate
Folate
10%
0%
7.3%
5.4%
5.3%
13%
6%
15%
17%
0%
73%
27%
7
100 g
300 g
0.5 cup dry - 28g 1.5 oz - 43g
Vitamin C
Vit. C
Vitamin D
Vit. D
Vitamin A
Vit. A
Vitamin E
Vit. E
Vitamin B1
Vit. B1
Vitamin B2
Vit. B2
Vitamin B3
Vit. B3
Vitamin B5
Vit. B5
Vitamin B6
Vit. B6
Vitamin B12
Vit. B12
Vitamin K
Vit. K
Folate
Folate
0%
0%
0%
46%
145%
97%
112%
32%
25%
0%
3.5%
80%
All nutrients comparison - raw data values
Nutrient
DV% diff.
Selenium
0.4µg
43µg
77%
Iron
0.2mg
4.73mg
57%
Sodium
80mg
1174mg
48%
Vitamin B1
0.021mg
0.578mg
46%
Vitamin B3
0.32mg
5.95mg
35%
Vitamin B2
0.057mg
0.421mg
28%
Calories
16kcal
475kcal
23%
Fats
0.17g
15.43g
23%
Carbs
2.97g
72.8g
23%
Vitamin K
29.3µg
1.4µg
23%
Polyunsaturated fat
0.079g
3.571g
23%
Monounsaturated fat
0.032g
8.929g
22%
Phosphorus
24mg
161mg
20%
Folate
36µg
106µg
18%
Protein
0.69g
8.11g
15%
Copper
0.035mg
0.167mg
15%
Vitamin E
0.27mg
2.3mg
14%
Zinc
0.13mg
1.4mg
12%
Magnesium
11mg
52mg
10%
Saturated fat
0.042g
2.229g
10%
Fiber
1.6g
3.7g
8%
Vitamin B5
0.246mg
0.533mg
6%
Potassium
260mg
120mg
4%
Manganese
0.103mg
4%
Vitamin C
3.1mg
0mg
3%
Vitamin B6
0.074mg
0.11mg
3%
Calcium
40mg
20mg
2%
Vitamin A
22µg
0µg
2%
Protein per 100 calories
4.3g
1.7g
N/A
Calories per 10 g protein
232kcal
586kcal
N/A
Weight per 100 calories
625g
21g
N/A
Unsaturated / Saturated Fat ratio
2.6
5.6
N/A
Net carbs
1.37g
69.1g
N/A
Sugar
1.34g
5.71g
N/A
Trans fat
0g
0.8g
N/A
Choline
6.1mg
8.7mg
0%
Tryptophan
0.009mg
0%
Threonine
0.02mg
0%
Isoleucine
0.021mg
0%
Leucine
0.032mg
0%
Lysine
0.027mg
0%
Methionine
0.005mg
0%
Phenylalanine
0.02mg
0%
Valine
0.027mg
0%
Histidine
0.012mg
0%
Fructose
0.37g
0%
Macronutrient Comparison
Macronutrient breakdown side-by-side comparison
1
3%
95%
Protein:
0.69 g
Fats:
0.17 g
Carbs:
2.97 g
Water:
95.43 g
Other:
0.74 g
4
8%
15%
73%
2%
Protein:
8.11 g
Fats:
15.43 g
Carbs:
72.8 g
Water:
1.18 g
Other:
2.48 g
Contains
more
Water Water
+7987.3%
Contains
more
Protein Protein
+1075.4%
Contains
more
Fats Fats
+8976.5%
Contains
more
Carbs Carbs
+2351.2%
Contains
more
Other Other
+235.1%
Fat Type Comparison
Fat type breakdown side-by-side comparison
1
27%
21%
52%
Saturated fat:
Sat. Fat
0.042 g
Monounsaturated fat:
Mono. Fat
0.032 g
Polyunsaturated fat:
Poly. Fat
0.079 g
2
15%
61%
24%
Saturated fat:
Sat. Fat
2.229 g
Monounsaturated fat:
Mono. Fat
8.929 g
Polyunsaturated fat:
Poly. Fat
3.571 g
Contains
less
Sat. Fat Saturated fat
-98.1%
Contains
more
Mono. Fat Monounsaturated fat
+27803.1%
Contains
more
Poly. Fat Polyunsaturated fat
+4420.3%