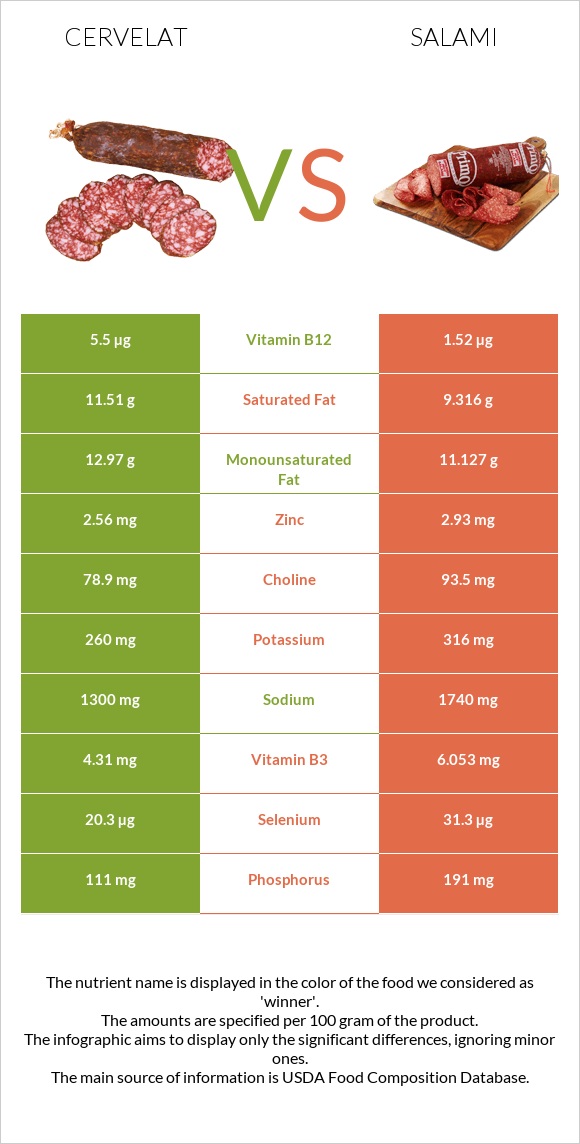
What are the differences between cervelat and salami? Cervelat is higher in vitamin B12 and vitamin C; however, salami is richer in copper, selenium, vitamin B1, vitamin B6, phosphorus, and vitamin B3. Cervelat's daily need coverage for vitamin B12 is 166% more. Salami has less saturated fat. We used Thuringer, cervelat, summer sausage, beef, pork and Salami, cooked, beef, and pork types in this article.
Infographic
Mineral Comparison
Mineral comparison score is based on the number of minerals by which one or the other food is richer. The "coverage" charts below show how much of the daily needs can be covered by 300 grams of the food.
2
100 g
300 g
2 oz 1 serving - 56g
Magnesium
Magnesium
Calcium
Calcium
Potassium
Potassium
Iron
Iron
Copper
Copper
Zinc
Zinc
Phosphorus
Phosphorus
Sodium
Sodium
Manganese
Manganese
Selenium
Selenium
10%
2.7%
23%
77%
50%
70%
48%
170%
0%
111%
8
100 g
300 g
1 slice round - 12.3g
Magnesium
Magnesium
Calcium
Calcium
Potassium
Potassium
Iron
Iron
Copper
Copper
Zinc
Zinc
Phosphorus
Phosphorus
Sodium
Sodium
Manganese
Manganese
Selenium
Selenium
14%
4.5%
28%
59%
119%
80%
82%
227%
128%
171%
Vitamin Comparison
Vitamin comparison score is based on the number of vitamins by which one or the other food is richer. The "coverage" charts below show how much of the daily needs can be covered by 300 grams of the food.
2
100 g
300 g
2 oz 1 serving - 56g
Vitamin C
Vit. C
Vitamin D
Vit. D
Vitamin A
Vit. A
Vitamin E
Vit. E
Vitamin B1
Vit. B1
Vitamin B2
Vit. B2
Vitamin B3
Vit. B3
Vitamin B5
Vit. B5
Vitamin B6
Vit. B6
Vitamin B12
Vit. B12
Vitamin K
Vit. K
Folate
Folate
55%
17%
0%
4.4%
38%
76%
81%
0%
60%
688%
3.3%
1.5%
6
100 g
300 g
1 slice round - 12.3g
Vitamin C
Vit. C
Vitamin D
Vit. D
Vitamin A
Vit. A
Vitamin E
Vit. E
Vitamin B1
Vit. B1
Vitamin B2
Vit. B2
Vitamin B3
Vit. B3
Vitamin B5
Vit. B5
Vitamin B6
Vit. B6
Vitamin B12
Vit. B12
Vitamin K
Vit. K
Folate
Folate
0%
15%
0%
4.4%
92%
82%
113%
72%
106%
190%
8%
2.3%
All nutrients comparison - raw data values
Nutrient
DV% diff.
Vitamin B12
5.5µg
1.52µg
166%
Manganese
0.978mg
43%
Vitamin B5
1.201mg
24%
Copper
0.15mg
0.357mg
23%
Selenium
20.3µg
31.3µg
20%
Sodium
1300mg
1740mg
19%
Vitamin C
16.6mg
0mg
18%
Vitamin B1
0.15mg
0.367mg
18%
Vitamin B6
0.26mg
0.459mg
15%
Phosphorus
111mg
191mg
11%
Vitamin B3
4.31mg
6.053mg
11%
Saturated fat
11.51g
9.316g
10%
Protein
17.45g
21.85g
9%
Polyunsaturated fat
1.2g
2.529g
9%
Fats
30.43g
25.9g
7%
Iron
2.04mg
1.56mg
6%
Cholesterol
74mg
89mg
5%
Monounsaturated fat
12.97g
11.127g
5%
Zinc
2.56mg
2.93mg
3%
Choline
78.9mg
93.5mg
3%
Potassium
260mg
316mg
2%
Vitamin B2
0.33mg
0.357mg
2%
Vitamin K
1.3µg
3.2µg
2%
Calories
362kcal
336kcal
1%
Vitamin D
1.1µg
1µg
1%
Magnesium
14mg
19mg
1%
Calcium
9mg
15mg
1%
Protein per 100 calories
4.8g
6.5g
N/A
Calories per 10 g protein
207kcal
154kcal
N/A
Weight per 100 calories
28g
30g
N/A
Unsaturated / Saturated Fat ratio
1.2
1.5
N/A
Net carbs
3.33g
2.4g
N/A
Carbs
3.33g
2.4g
0%
Vitamin D*
44 IU
41 IU
0%
Sugar
0.85g
0.96g
N/A
Vitamin E
0.22mg
0.22mg
0%
Folate
2µg
3µg
0%
Trans fat
0.586g
N/A
Tryptophan
0.114mg
0%
Threonine
0.521mg
0%
Isoleucine
0.675mg
0%
Leucine
0.929mg
0%
Lysine
1.107mg
0%
Methionine
0.301mg
0%
Phenylalanine
0.481mg
0%
Valine
0.668mg
0%
Histidine
0.359mg
0%
Omega-3 - ALA
0.126g
N/A
Omega-6 - Eicosadienoic acid
0.084g
N/A
Omega-6 - Linoleic acid
2.104g
N/A
Macronutrient Comparison
Macronutrient breakdown side-by-side comparison
2
17%
30%
3%
45%
4%
Protein:
17.45 g
Fats:
30.43 g
Carbs:
3.33 g
Water:
45.18 g
Other:
3.61 g
3
22%
26%
2%
45%
5%
Protein:
21.85 g
Fats:
25.9 g
Carbs:
2.4 g
Water:
45.19 g
Other:
4.66 g
Contains
more
Fats Fats
+17.5%
Contains
more
Carbs Carbs
+38.8%
Contains
more
Protein Protein
+25.2%
Contains
more
Other Other
+29.1%
Fat Type Comparison
Fat type breakdown side-by-side comparison
1
45%
51%
5%
Saturated fat:
Sat. Fat
11.51 g
Monounsaturated fat:
Mono. Fat
12.97 g
Polyunsaturated fat:
Poly. Fat
1.2 g
2
41%
48%
11%
Saturated fat:
Sat. Fat
9.316 g
Monounsaturated fat:
Mono. Fat
11.127 g
Polyunsaturated fat:
Poly. Fat
2.529 g
Contains
more
Mono. Fat Monounsaturated fat
+16.6%
Contains
less
Sat. Fat Saturated fat
-19.1%
Contains
more
Poly. Fat Polyunsaturated fat
+110.8%