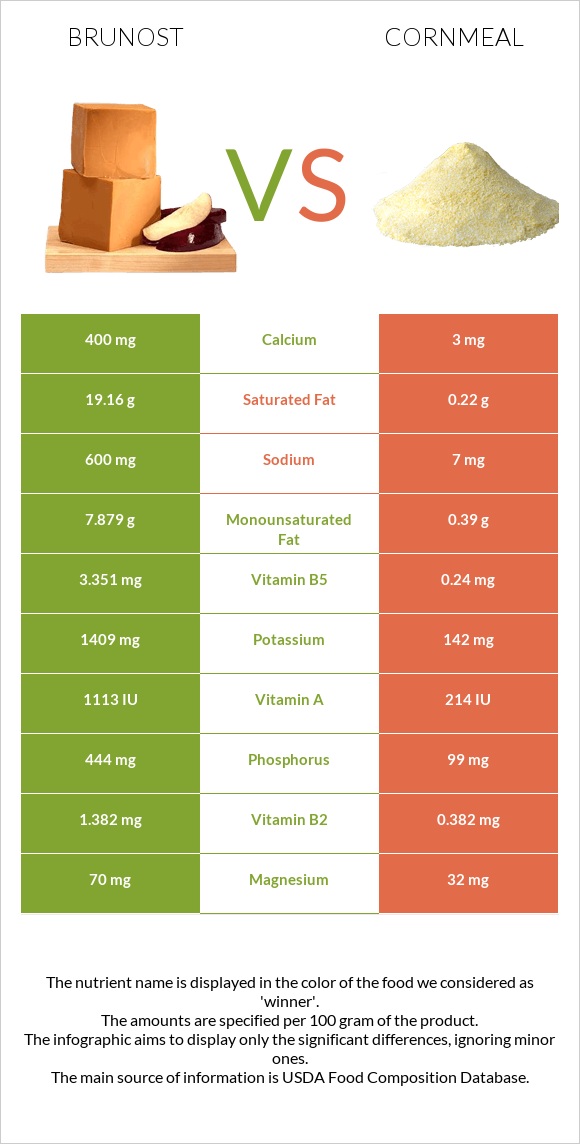
Summary of differences between brunost and cornmeal Brunost has more vitamin B12, vitamin B2, vitamin B5, phosphorus, calcium, and potassium, while cornmeal has more folate and iron. Brunost covers your daily need for vitamin B12, 101% more than cornmeal. Brunost has a lower glycemic index. The glycemic index of brunost is 27, while the glycemic index of cornmeal is 68. These are the specific foods used in this comparison Cheese, gjetost and Cornmeal, degermed, enriched, yellow .
Infographic
Mineral Comparison
Mineral comparison score is based on the number of minerals by which one or the other food is richer. The "coverage" charts below show how much of the daily needs can be covered by 300 grams of the food.
6
100 g
300 g
1 oz - 28.35g 1 package (8 oz) - 227g
Magnesium
Magnesium
Calcium
Calcium
Potassium
Potassium
Iron
Iron
Copper
Copper
Zinc
Zinc
Phosphorus
Phosphorus
Sodium
Sodium
Manganese
Manganese
Selenium
Selenium
50%
120%
124%
20%
27%
31%
190%
78%
5.2%
79%
3
100 g
300 g
1 cup - 157g
Magnesium
Magnesium
Calcium
Calcium
Potassium
Potassium
Iron
Iron
Copper
Copper
Zinc
Zinc
Phosphorus
Phosphorus
Sodium
Sodium
Manganese
Manganese
Selenium
Selenium
23%
0.9%
13%
164%
25%
18%
42%
0.91%
23%
57%
Vitamin Comparison
Vitamin comparison score is based on the number of vitamins by which one or the other food is richer. The "coverage" charts below show how much of the daily needs can be covered by 300 grams of the food.
5
100 g
300 g
1 oz - 28.35g 1 package (8 oz) - 227g
Vitamin C
Vit. C
Vitamin D
Vit. D
Vitamin A
Vit. A
Vitamin E
Vit. E
Vitamin B1
Vit. B1
Vitamin B2
Vit. B2
Vitamin B3
Vit. B3
Vitamin B5
Vit. B5
Vitamin B6
Vit. B6
Vitamin B12
Vit. B12
Vitamin K
Vit. K
Folate
Folate
0%
0%
111%
0%
79%
319%
15%
201%
63%
303%
0%
3.8%
4
100 g
300 g
1 cup - 157g
Vitamin C
Vit. C
Vitamin D
Vit. D
Vitamin A
Vit. A
Vitamin E
Vit. E
Vitamin B1
Vit. B1
Vitamin B2
Vit. B2
Vitamin B3
Vit. B3
Vitamin B5
Vit. B5
Vitamin B6
Vit. B6
Vitamin B12
Vit. B12
Vitamin K
Vit. K
Folate
Folate
0%
0%
3.7%
2.4%
138%
88%
93%
14%
42%
0%
0%
157%
All nutrients comparison - raw data values
Nutrient
DV% diff.
Vitamin B12
2.42µg
0µg
101%
Saturated fat
19.16g
0.22g
86%
Vitamin B2
1.382mg
0.382mg
77%
Vitamin B5
3.351mg
0.24mg
62%
Folate
5µg
209µg
51%
Phosphorus
444mg
99mg
49%
Iron
0.52mg
4.36mg
48%
Fats
29.51g
1.75g
43%
Calcium
400mg
3mg
40%
Potassium
1409mg
142mg
37%
Vitamin A
334µg
11µg
36%
Cholesterol
94mg
0mg
31%
Starch
73.3g
30%
Sodium
600mg
7mg
26%
Vitamin B3
0.813mg
4.968mg
26%
Vitamin B1
0.315mg
0.551mg
20%
Monounsaturated fat
7.879g
0.39g
19%
Fiber
0g
3.9g
16%
Carbs
42.65g
79.45g
12%
Magnesium
70mg
32mg
9%
Selenium
14.5µg
10.5µg
7%
Vitamin B6
0.271mg
0.182mg
7%
Manganese
0.04mg
0.174mg
6%
Calories
466kcal
370kcal
5%
Protein
9.65g
7.11g
5%
Zinc
1.14mg
0.66mg
4%
Choline
8.6mg
2%
Vitamin E
0.12mg
1%
Polyunsaturated fat
0.938g
0.828g
1%
Protein per 100 calories
2.1g
1.9g
N/A
Calories per 10 g protein
483kcal
520kcal
N/A
Weight per 100 calories
21g
27g
N/A
Unsaturated / Saturated Fat ratio
0.46
5.5
N/A
Net carbs
42.65g
75.55g
N/A
Sugar
1.61g
N/A
Copper
0.08mg
0.076mg
0%
Tryptophan
0.135mg
0.038mg
0%
Threonine
0.393mg
0.172mg
0%
Isoleucine
0.519mg
0.242mg
0%
Leucine
0.992mg
1.006mg
0%
Lysine
0.814mg
0.105mg
0%
Methionine
0.318mg
0.162mg
0%
Phenylalanine
0.54mg
0.366mg
0%
Valine
0.765mg
0.337mg
0%
Histidine
0.293mg
0.172mg
0%
Fructose
0.17g
0%
Macronutrient Comparison
Macronutrient breakdown side-by-side comparison
4
10%
30%
43%
13%
5%
Protein:
9.65 g
Fats:
29.51 g
Carbs:
42.65 g
Water:
13.44 g
Other:
4.75 g
1
7%
2%
79%
11%
Protein:
7.11 g
Fats:
1.75 g
Carbs:
79.45 g
Water:
11.18 g
Other:
0.51 g
Contains
more
Protein Protein
+35.7%
Contains
more
Fats Fats
+1586.3%
Contains
more
Water Water
+20.2%
Contains
more
Other Other
+831.4%
Contains
more
Carbs Carbs
+86.3%
Fat Type Comparison
Fat type breakdown side-by-side comparison
2
68%
28%
3%
Saturated fat:
Sat. Fat
19.16 g
Monounsaturated fat:
Mono. Fat
7.879 g
Polyunsaturated fat:
Poly. Fat
0.938 g
1
15%
27%
58%
Saturated fat:
Sat. Fat
0.22 g
Monounsaturated fat:
Mono. Fat
0.39 g
Polyunsaturated fat:
Poly. Fat
0.828 g
Contains
more
Mono. Fat Monounsaturated fat
+1920.3%
Contains
more
Poly. Fat Polyunsaturated fat
+13.3%
Contains
less
Sat. Fat Saturated fat
-98.9%