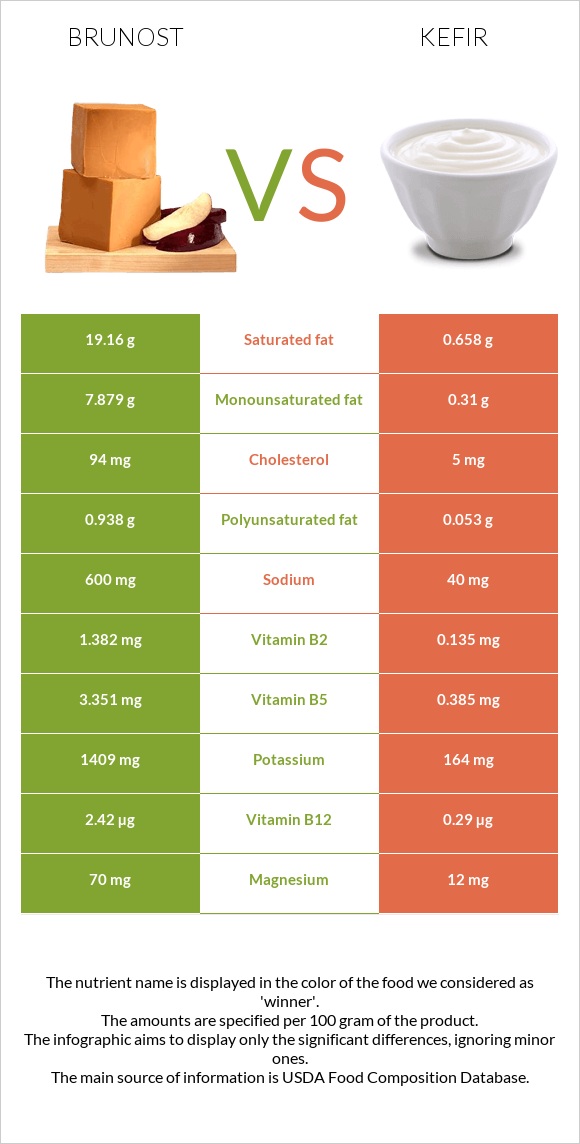
Significant differences between brunost and kefir The amount of vitamin B2, vitamin B12, vitamin B5, phosphorus, potassium, calcium, and vitamin B1 in brunost is higher than in kefir. Brunost covers your daily vitamin B2 needs 96% more than kefir. Kefir has 29 times less saturated fat than brunost. Brunost has 19.16g of saturated fat, while kefir has 0.658g. Specific food types used in this comparison are Cheese, gjetost and Kefir, lowfat, plain, LIFEWAY .
Infographic
Mineral Comparison
Mineral comparison score is based on the number of minerals by which one or the other food is richer. The "coverage" charts below show how much of the daily needs can be covered by 300 grams of the food.
9
100 g
300 g
1 oz - 28.35g 1 package (8 oz) - 227g
Magnesium
Magnesium
Calcium
Calcium
Potassium
Potassium
Iron
Iron
Copper
Copper
Zinc
Zinc
Phosphorus
Phosphorus
Sodium
Sodium
Manganese
Manganese
Selenium
Selenium
50%
120%
124%
20%
27%
31%
190%
78%
5.2%
79%
1
100 g
300 g
Magnesium
Magnesium
Calcium
Calcium
Potassium
Potassium
Iron
Iron
Copper
Copper
Zinc
Zinc
Phosphorus
Phosphorus
Sodium
Sodium
Manganese
Manganese
Selenium
Selenium
8.6%
39%
14%
1.5%
3%
13%
45%
5.2%
0.65%
20%
Vitamin Comparison
Vitamin comparison score is based on the number of vitamins by which one or the other food is richer. The "coverage" charts below show how much of the daily needs can be covered by 300 grams of the food.
7
100 g
300 g
1 oz - 28.35g 1 package (8 oz) - 227g
Vitamin C
Vit. C
Vitamin D
Vit. D
Vitamin A
Vit. A
Vitamin E
Vit. E
Vitamin B1
Vit. B1
Vitamin B2
Vit. B2
Vitamin B3
Vit. B3
Vitamin B5
Vit. B5
Vitamin B6
Vit. B6
Vitamin B12
Vit. B12
Vitamin K
Vit. K
Folate
Folate
0%
0%
111%
0%
79%
319%
15%
201%
63%
303%
0%
3.8%
5
100 g
300 g
Vitamin C
Vit. C
Vitamin D
Vit. D
Vitamin A
Vit. A
Vitamin E
Vit. E
Vitamin B1
Vit. B1
Vitamin B2
Vit. B2
Vitamin B3
Vit. B3
Vitamin B5
Vit. B5
Vitamin B6
Vit. B6
Vitamin B12
Vit. B12
Vitamin K
Vit. K
Folate
Folate
0.67%
15%
57%
0.4%
7.5%
31%
2.8%
23%
13%
36%
0.25%
9.8%
All nutrients comparison - raw data values
Nutrient
DV% diff.
Vitamin B2
1.382mg
0.135mg
96%
Vitamin B12
2.42µg
0.29µg
89%
Saturated fat
19.16g
0.658g
84%
Vitamin B5
3.351mg
0.385mg
59%
Phosphorus
444mg
105mg
48%
Fats
29.51g
0.93g
44%
Potassium
1409mg
164mg
37%
Cholesterol
94mg
5mg
30%
Calcium
400mg
130mg
27%
Sodium
600mg
40mg
24%
Vitamin B1
0.315mg
0.03mg
24%
Calories
466kcal
41kcal
21%
Selenium
14.5µg
3.6µg
20%
Monounsaturated fat
7.879g
0.31g
19%
Vitamin A
334µg
171µg
18%
Vitamin B6
0.271mg
0.058mg
16%
Magnesium
70mg
12mg
14%
Carbs
42.65g
4.48g
13%
Protein
9.65g
3.79g
12%
Copper
0.08mg
0.009mg
8%
Iron
0.52mg
0.04mg
6%
Zinc
1.14mg
0.46mg
6%
Polyunsaturated fat
0.938g
0.053g
6%
Vitamin D*
41 IU
5%
Vitamin D
1µg
5%
Vitamin B3
0.813mg
0.15mg
4%
Choline
15.2mg
3%
Manganese
0.04mg
0.005mg
2%
Folate
5µg
13µg
2%
Protein per 100 calories
2.1g
9.2g
N/A
Calories per 10 g protein
483kcal
108kcal
N/A
Weight per 100 calories
21g
244g
N/A
Unsaturated / Saturated Fat ratio
0.46
0.55
N/A
Vitamin C
0mg
0.2mg
0%
Net carbs
42.65g
4.48g
N/A
Sugar
4.61g
N/A
Vitamin E
0.02mg
0%
Vitamin K
0.1µg
0%
Trans fat
0.037g
N/A
Tryptophan
0.135mg
0%
Threonine
0.393mg
0%
Isoleucine
0.519mg
0%
Leucine
0.992mg
0%
Lysine
0.814mg
0%
Methionine
0.318mg
0%
Phenylalanine
0.54mg
0%
Valine
0.765mg
0%
Histidine
0.293mg
0%
Omega-3 - ALA
0.006g
N/A
Omega-3 - DPA
0.001g
N/A
Omega-6 - Dihomo-gamma-linoleic acid
0.002g
N/A
Omega-6 - Linoleic acid
0.029g
N/A
Macronutrient Comparison
Macronutrient breakdown side-by-side comparison
4
10%
30%
43%
13%
5%
Protein:
9.65 g
Fats:
29.51 g
Carbs:
42.65 g
Water:
13.44 g
Other:
4.75 g
1
4%
4%
90%
Protein:
3.79 g
Fats:
0.93 g
Carbs:
4.48 g
Water:
90.07 g
Other:
0.73 g
Contains
more
Protein Protein
+154.6%
Contains
more
Fats Fats
+3073.1%
Contains
more
Carbs Carbs
+852%
Contains
more
Other Other
+550.7%
Contains
more
Water Water
+570.2%
Fat Type Comparison
Fat type breakdown side-by-side comparison
2
68%
28%
3%
Saturated fat:
Sat. Fat
19.16 g
Monounsaturated fat:
Mono. Fat
7.879 g
Polyunsaturated fat:
Poly. Fat
0.938 g
1
64%
30%
5%
Saturated fat:
Sat. Fat
0.658 g
Monounsaturated fat:
Mono. Fat
0.31 g
Polyunsaturated fat:
Poly. Fat
0.053 g
Contains
more
Mono. Fat Monounsaturated fat
+2441.6%
Contains
more
Poly. Fat Polyunsaturated fat
+1669.8%
Contains
less
Sat. Fat Saturated fat
-96.6%