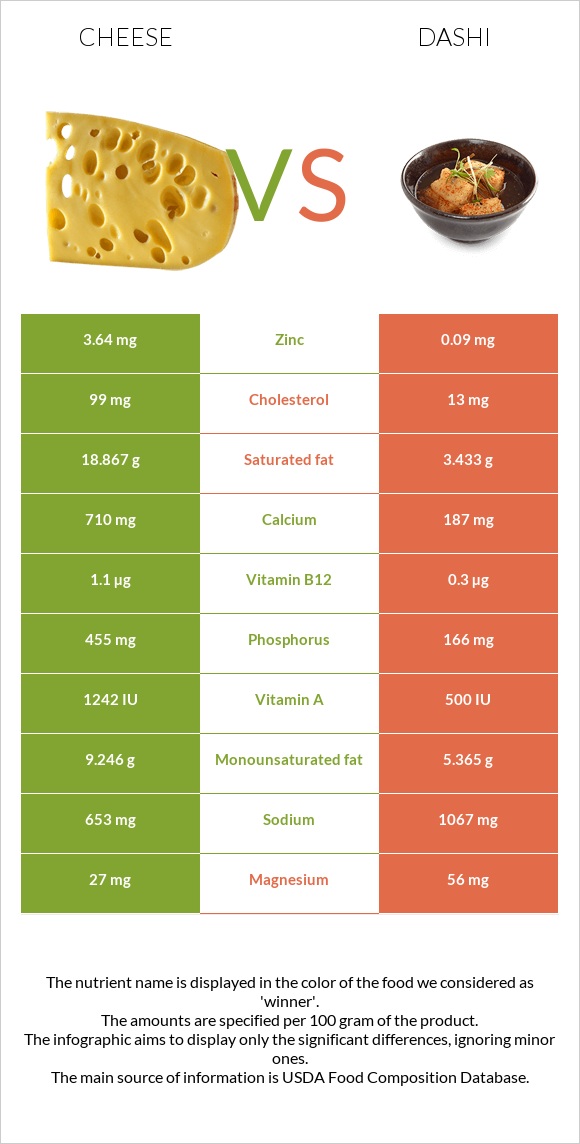
Significant differences between cheese and dashi Cheese has more calcium, phosphorus, vitamin B12, and zinc; however, dashi is richer in vitamin K, choline, and vitamin B3. Cheese covers your daily saturated fat needs 77% more than dashi. Dashi has 40 times less zinc than cheese. Cheese has 3.64mg of zinc, while dashi has 0.09mg. Dashi contains less cholesterol. Specific food types used in this comparison are Cheese, cheddar and Soup, bouillon cubes, and granules, low sodium, dry .
Infographic
Mineral Comparison
Mineral comparison score is based on the number of minerals by which one or the other food is richer. The "coverage" charts below show how much of the daily needs can be covered by 300 grams of the food.
6
100 g
300 g
1 cubic inch - 17g 1 slice (1 oz) - 28g 1 oz - 28.35g 1 cup, shredded - 113g 1 cup, diced - 132g 1 cup, melted - 244g
Magnesium
Magnesium
Calcium
Calcium
Potassium
Potassium
Iron
Iron
Copper
Copper
Zinc
Zinc
Phosphorus
Phosphorus
Sodium
Sodium
Manganese
Manganese
Selenium
Selenium
19%
213%
6.7%
5.3%
10%
99%
195%
85%
3.5%
155%
3
100 g
300 g
1 tsp - 2.6g 1 cube - 3.6g
Magnesium
Magnesium
Calcium
Calcium
Potassium
Potassium
Iron
Iron
Copper
Copper
Zinc
Zinc
Phosphorus
Phosphorus
Sodium
Sodium
Manganese
Manganese
Selenium
Selenium
40%
56%
27%
39%
0%
2.5%
71%
139%
0%
151%
Vitamin Comparison
Vitamin comparison score is based on the number of vitamins by which one or the other food is richer. The "coverage" charts below show how much of the daily needs can be covered by 300 grams of the food.
5
100 g
300 g
1 cubic inch - 17g 1 slice (1 oz) - 28g 1 oz - 28.35g 1 cup, shredded - 113g 1 cup, diced - 132g 1 cup, melted - 244g
Vitamin C
Vit. C
Vitamin D
Vit. D
Vitamin A
Vit. A
Vitamin E
Vit. E
Vitamin B1
Vit. B1
Vitamin B2
Vit. B2
Vitamin B3
Vit. B3
Vitamin B5
Vit. B5
Vitamin B6
Vit. B6
Vitamin B12
Vit. B12
Vitamin K
Vit. K
Folate
Folate
0%
9%
110%
14%
7.3%
99%
1.1%
25%
15%
138%
6%
20%
5
100 g
300 g
1 tsp - 2.6g 1 cube - 3.6g
Vitamin C
Vit. C
Vitamin D
Vit. D
Vitamin A
Vit. A
Vitamin E
Vit. E
Vitamin B1
Vit. B1
Vitamin B2
Vit. B2
Vitamin B3
Vit. B3
Vitamin B5
Vit. B5
Vitamin B6
Vit. B6
Vitamin B12
Vit. B12
Vitamin K
Vit. K
Folate
Folate
3.7%
0%
8.3%
14%
25%
99%
46%
0%
23%
38%
167%
16%
All nutrients comparison - raw data values
Nutrient
DV% diff.
Saturated fat
18.867g
3.433g
70%
Vitamin K
2.4µg
66.9µg
54%
Calcium
710mg
187mg
52%
Phosphorus
455mg
166mg
41%
Vitamin A
330µg
25µg
34%
Vitamin B12
1.1µg
0.3µg
33%
Zinc
3.64mg
0.09mg
32%
Fats
33.31g
13.89g
30%
Cholesterol
99mg
13mg
29%
Carbs
3.09g
64.88g
21%
Polyunsaturated fat
1.421g
4.485g
20%
Sodium
653mg
1067mg
18%
Choline
16.5mg
114.5mg
18%
Vitamin B3
0.059mg
2.46mg
15%
Protein
22.87g
16.7g
12%
Iron
0.14mg
1.03mg
11%
Monounsaturated fat
9.246g
5.365g
10%
Vitamin B5
0.41mg
8%
Magnesium
27mg
56mg
7%
Potassium
76mg
309mg
7%
Vitamin B1
0.029mg
0.1mg
6%
Vitamin D*
24 IU
0 IU
3%
Vitamin D
0.6µg
0µg
3%
Copper
0.03mg
0mg
3%
Vitamin B6
0.066mg
0.1mg
3%
Calories
404kcal
438kcal
2%
Selenium
28.5µg
27.6µg
2%
Folate
27µg
21µg
2%
Vitamin C
0mg
1.1mg
1%
Fiber
0g
0.2g
1%
Manganese
0.027mg
1%
Protein per 100 calories
5.7g
3.8g
N/A
Calories per 10 g protein
177kcal
262kcal
N/A
Weight per 100 calories
25g
23g
N/A
Unsaturated / Saturated Fat ratio
0.57
2.9
N/A
Net carbs
3.09g
64.68g
N/A
Sugar
0.48g
14.47g
N/A
Vitamin E
0.71mg
0.72mg
0%
Vitamin B2
0.428mg
0.43mg
0%
Trans fat
0.917g
N/A
Tryptophan
0.547mg
0%
Threonine
1.044mg
0%
Isoleucine
1.206mg
0%
Leucine
1.939mg
0%
Lysine
1.025mg
0%
Methionine
0.547mg
0%
Phenylalanine
1.074mg
0%
Valine
1.404mg
0%
Histidine
0.547mg
0%
Omega-3 - EPA
0.01g
0g
N/A
Omega-3 - DHA
0.001g
0g
N/A
Omega-3 - DPA
0.017g
0g
N/A
Omega-6 - Eicosadienoic acid
0.007g
N/A
Macronutrient Comparison
Macronutrient breakdown side-by-side comparison
4
23%
33%
3%
37%
4%
Protein:
22.87 g
Fats:
33.31 g
Carbs:
3.09 g
Water:
37.02 g
Other:
3.71 g
1
17%
14%
65%
2%
2%
Protein:
16.7 g
Fats:
13.89 g
Carbs:
64.88 g
Water:
2.3 g
Other:
2.23 g
Contains
more
Protein Protein
+36.9%
Contains
more
Fats Fats
+139.8%
Contains
more
Water Water
+1509.6%
Contains
more
Other Other
+66.4%
Contains
more
Carbs Carbs
+1999.7%
Fat Type Comparison
Fat type breakdown side-by-side comparison
1
64%
31%
5%
Saturated fat:
Sat. Fat
18.867 g
Monounsaturated fat:
Mono. Fat
9.246 g
Polyunsaturated fat:
Poly. Fat
1.421 g
2
26%
40%
34%
Saturated fat:
Sat. Fat
3.433 g
Monounsaturated fat:
Mono. Fat
5.365 g
Polyunsaturated fat:
Poly. Fat
4.485 g
Contains
more
Mono. Fat Monounsaturated fat
+72.3%
Contains
less
Sat. Fat Saturated fat
-81.8%
Contains
more
Poly. Fat Polyunsaturated fat
+215.6%