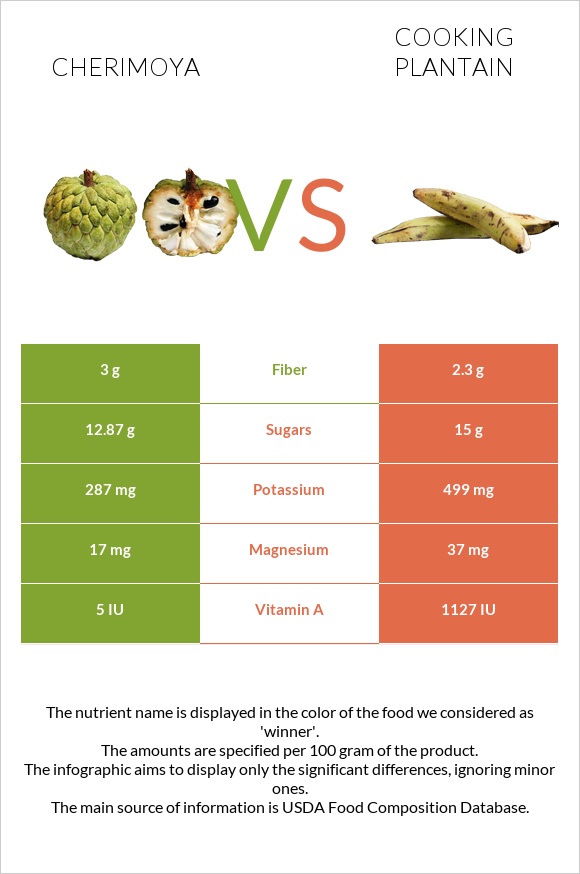
Significant differences between cherimoya and plantains Cherimoya has more vitamin B2; however, plantains are richer in vitamin A and potassium. Plantains cover your daily vitamin A needs 18% more than cherimoya. Plantains have 3 times less vitamin B2 than cherimoya. Cherimoya has 0.131mg of vitamin B2, while plantains have 0.052mg. Cherimoya has a higher glycemic index. The glycemic index of cherimoya is 59, while the glycemic index of plantains is 37. Specific food types used in this comparison are Cherimoya, raw and Plantains, cooked .
Infographic
Mineral Comparison
Mineral comparison score is based on the number of minerals by which one or the other food is richer. The "coverage" charts below show how much of the daily needs can be covered by 300 grams of the food.
3
100 g
300 g
1 cup, pieces - 160g 1 fruit without skin and seeds - 235g
Magnesium
Magnesium
Calcium
Calcium
Potassium
Potassium
Iron
Iron
Copper
Copper
Zinc
Zinc
Phosphorus
Phosphorus
Sodium
Sodium
Manganese
Manganese
Selenium
Selenium
12%
3%
25%
10%
23%
4.4%
11%
0.91%
12%
0%
5
100 g
300 g
1 cup slices - 154g 1 cup, mashed - 200g
Magnesium
Magnesium
Calcium
Calcium
Potassium
Potassium
Iron
Iron
Copper
Copper
Zinc
Zinc
Phosphorus
Phosphorus
Sodium
Sodium
Manganese
Manganese
Selenium
Selenium
23%
0.6%
41%
22%
22%
3.5%
12%
0.65%
0%
7.6%
Vitamin Comparison
Vitamin comparison score is based on the number of vitamins by which one or the other food is richer. The "coverage" charts below show how much of the daily needs can be covered by 300 grams of the food.
5
100 g
300 g
1 cup, pieces - 160g 1 fruit without skin and seeds - 235g
Vitamin C
Vit. C
Vitamin D
Vit. D
Vitamin A
Vit. A
Vitamin E
Vit. E
Vitamin B1
Vit. B1
Vitamin B2
Vit. B2
Vitamin B3
Vit. B3
Vitamin B5
Vit. B5
Vitamin B6
Vit. B6
Vitamin B12
Vit. B12
Vitamin K
Vit. K
Folate
Folate
42%
0%
0%
5.4%
25%
30%
12%
21%
59%
0%
0%
17%
4
100 g
300 g
1 cup slices - 154g 1 cup, mashed - 200g
Vitamin C
Vit. C
Vitamin D
Vit. D
Vitamin A
Vit. A
Vitamin E
Vit. E
Vitamin B1
Vit. B1
Vitamin B2
Vit. B2
Vitamin B3
Vit. B3
Vitamin B5
Vit. B5
Vitamin B6
Vit. B6
Vitamin B12
Vit. B12
Vitamin K
Vit. K
Folate
Folate
36%
0%
15%
2.6%
12%
12%
14%
14%
55%
0%
1.8%
20%
All nutrients comparison - raw data values
Nutrient
DV% diff.
Fructose
6.28g
8%
Vitamin B2
0.131mg
0.052mg
6%
Potassium
287mg
465mg
5%
Vitamin A
0µg
45µg
5%
Vitamin B1
0.101mg
0.046mg
5%
Carbs
17.71g
31.15g
4%
Magnesium
17mg
32mg
4%
Iron
0.27mg
0.58mg
4%
Manganese
0.093mg
4%
Fiber
3g
2.3g
3%
Selenium
1.4µg
3%
Calories
75kcal
116kcal
2%
Protein
1.57g
0.79g
2%
Vitamin C
12.6mg
10.9mg
2%
Vitamin B5
0.345mg
0.233mg
2%
Choline
12.7mg
2%
Fats
0.68g
0.18g
1%
Calcium
10mg
2mg
1%
Vitamin E
0.27mg
0.13mg
1%
Vitamin B3
0.644mg
0.756mg
1%
Vitamin B6
0.257mg
0.24mg
1%
Vitamin K
0.7µg
1%
Folate
23µg
26µg
1%
Saturated fat
0.233g
0.069g
1%
Polyunsaturated fat
0.188g
0.033g
1%
Protein per 100 calories
2.1g
0.68g
N/A
Calories per 10 g protein
478kcal
1468kcal
N/A
Weight per 100 calories
133g
86g
N/A
Net carbs
14.71g
28.85g
N/A
Sugar
12.87g
14g
N/A
Copper
0.069mg
0.066mg
0%
Zinc
0.16mg
0.13mg
0%
Phosphorus
26mg
28mg
0%
Sodium
7mg
5mg
0%
Monounsaturated fat
0.055g
0.015g
0%
Tryptophan
0.031mg
0.009mg
0%
Threonine
0.052mg
0.021mg
0%
Isoleucine
0.042mg
0.022mg
0%
Leucine
0.063mg
0.036mg
0%
Lysine
0.042mg
0.037mg
0%
Methionine
0.021mg
0.01mg
0%
Phenylalanine
0.042mg
0.027mg
0%
Valine
0.063mg
0.028mg
0%
Histidine
0.021mg
0.039mg
0%
Omega-3 - ALA
0.159g
N/A
Omega-6 - Linoleic acid
0.028g
N/A
Macronutrient Comparison
Macronutrient breakdown side-by-side comparison
4
18%
79%
Protein:
1.57 g
Fats:
0.68 g
Carbs:
17.71 g
Water:
79.39 g
Other:
0.65 g
1
31%
67%
Protein:
0.79 g
Fats:
0.18 g
Carbs:
31.15 g
Water:
67.3 g
Other:
0.58 g
Contains
more
Protein Protein
+98.7%
Contains
more
Fats Fats
+277.8%
Contains
more
Water Water
+18%
Contains
more
Other Other
+12.1%
Contains
more
Carbs Carbs
+75.9%
Fat Type Comparison
Fat type breakdown side-by-side comparison
2
49%
12%
39%
Saturated fat:
Sat. Fat
0.233 g
Monounsaturated fat:
Mono. Fat
0.055 g
Polyunsaturated fat:
Poly. Fat
0.188 g
1
59%
13%
28%
Saturated fat:
Sat. Fat
0.069 g
Monounsaturated fat:
Mono. Fat
0.015 g
Polyunsaturated fat:
Poly. Fat
0.033 g
Contains
more
Mono. Fat Monounsaturated fat
+266.7%
Contains
more
Poly. Fat Polyunsaturated fat
+469.7%
Contains
less
Sat. Fat Saturated fat
-70.4%