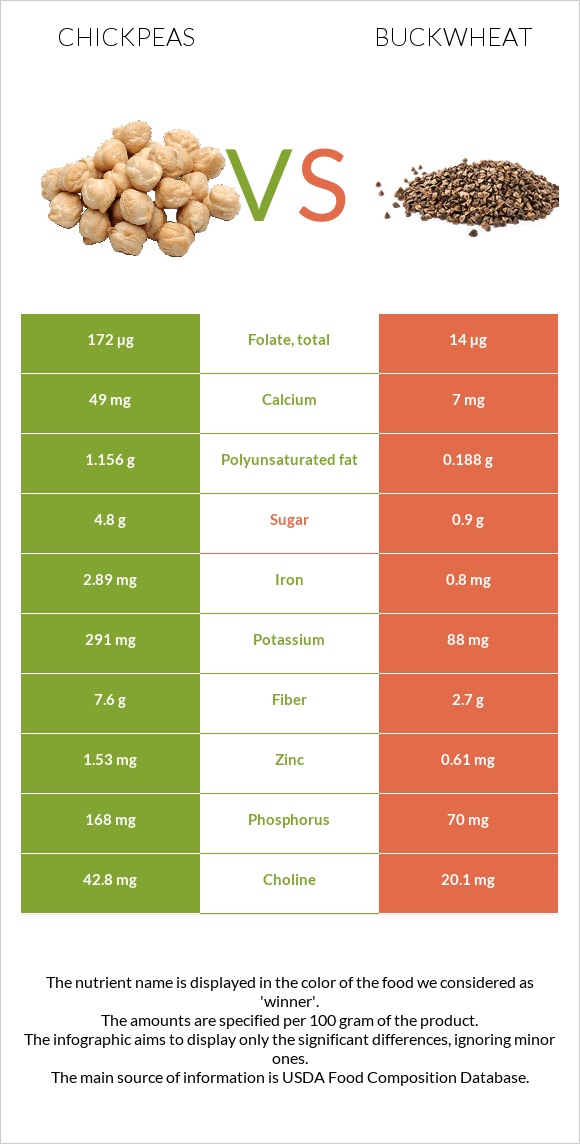
What are the differences between chickpeas and buckwheat? Chickpeas are richer than buckwheat in folate, manganese, iron, copper, fiber, phosphorus, zinc, vitamin B1, and potassium. Chickpeas' daily need coverage for folate is 40% more. Chickpeas have 7 times more calcium than buckwheat. While chickpeas have 49mg of calcium, buckwheat has only 7mg. The glycemic index of chickpeas is lower. We used Chickpeas (garbanzo beans, bengal gram), mature seeds, cooked, boiled, without salt and Buckwheat groats, roasted, cooked types in this article.
Infographic
Mineral Comparison
Mineral comparison score is based on the number of minerals by which one or the other food is richer. The "coverage" charts below show how much of the daily needs can be covered by 300 grams of the food.
8
100 g
300 g
1 cup - 164g
Magnesium
Magnesium
Calcium
Calcium
Potassium
Potassium
Iron
Iron
Copper
Copper
Zinc
Zinc
Phosphorus
Phosphorus
Sodium
Sodium
Manganese
Manganese
Selenium
Selenium
34%
15%
26%
108%
117%
42%
72%
0.91%
134%
20%
1
100 g
300 g
1 cup - 168g
Magnesium
Magnesium
Calcium
Calcium
Potassium
Potassium
Iron
Iron
Copper
Copper
Zinc
Zinc
Phosphorus
Phosphorus
Sodium
Sodium
Manganese
Manganese
Selenium
Selenium
36%
2.1%
7.8%
30%
49%
17%
30%
0.52%
53%
12%
Vitamin Comparison
Vitamin comparison score is based on the number of vitamins by which one or the other food is richer. The "coverage" charts below show how much of the daily needs can be covered by 300 grams of the food.
8
100 g
300 g
1 cup - 164g
Vitamin C
Vit. C
Vitamin D
Vit. D
Vitamin A
Vit. A
Vitamin E
Vit. E
Vitamin B1
Vit. B1
Vitamin B2
Vit. B2
Vitamin B3
Vit. B3
Vitamin B5
Vit. B5
Vitamin B6
Vit. B6
Vitamin B12
Vit. B12
Vitamin K
Vit. K
Folate
Folate
4.3%
0%
0.33%
7%
29%
15%
9.9%
17%
32%
0%
10%
129%
2
100 g
300 g
1 cup - 168g
Vitamin C
Vit. C
Vitamin D
Vit. D
Vitamin A
Vit. A
Vitamin E
Vit. E
Vitamin B1
Vit. B1
Vitamin B2
Vit. B2
Vitamin B3
Vit. B3
Vitamin B5
Vit. B5
Vitamin B6
Vit. B6
Vitamin B12
Vit. B12
Vitamin K
Vit. K
Folate
Folate
0%
0%
0%
1.8%
10%
9%
18%
22%
18%
0%
4.8%
11%
All nutrients comparison - raw data values
Nutrient
DV% diff.
Folate
172µg
14µg
40%
Manganese
1.03mg
0.403mg
27%
Iron
2.89mg
0.8mg
26%
Copper
0.352mg
0.146mg
23%
Fiber
7.6g
2.7g
20%
Phosphorus
168mg
70mg
14%
Protein
8.86g
3.38g
11%
Zinc
1.53mg
0.61mg
8%
Potassium
291mg
88mg
6%
Vitamin B1
0.116mg
0.04mg
6%
Polyunsaturated fat
1.156g
0.188g
6%
Vitamin B6
0.139mg
0.077mg
5%
Calories
164kcal
92kcal
4%
Calcium
49mg
7mg
4%
Choline
42.8mg
20.1mg
4%
Fats
2.59g
0.62g
3%
Selenium
3.7µg
2.2µg
3%
Vitamin B3
0.526mg
0.94mg
3%
Carbs
27.42g
19.94g
2%
Vitamin E
0.35mg
0.09mg
2%
Vitamin B2
0.063mg
0.039mg
2%
Vitamin K
4µg
1.9µg
2%
Vitamin C
1.3mg
0mg
1%
Magnesium
48mg
51mg
1%
Vitamin B5
0.286mg
0.359mg
1%
Saturated fat
0.269g
0.134g
1%
Monounsaturated fat
0.583g
0.188g
1%
Protein per 100 calories
5.4g
3.7g
N/A
Calories per 10 g protein
185kcal
272kcal
N/A
Weight per 100 calories
61g
109g
N/A
Unsaturated / Saturated Fat ratio
6.5
2.8
N/A
Net carbs
19.82g
17.24g
N/A
Sugar
4.8g
0.9g
N/A
Sodium
7mg
4mg
0%
Vitamin A
1µg
0µg
0%
Tryptophan
0.085mg
0.049mg
0%
Threonine
0.329mg
0.129mg
0%
Isoleucine
0.38mg
0.127mg
0%
Leucine
0.631mg
0.212mg
0%
Lysine
0.593mg
0.172mg
0%
Methionine
0.116mg
0.044mg
0%
Phenylalanine
0.475mg
0.133mg
0%
Valine
0.372mg
0.173mg
0%
Histidine
0.244mg
0.079mg
0%
Fructose
0.1g
0%
Macronutrient Comparison
Macronutrient breakdown side-by-side comparison
4
9%
3%
27%
60%
Protein:
8.86 g
Fats:
2.59 g
Carbs:
27.42 g
Water:
60.21 g
Other:
0.92 g
1
3%
20%
76%
Protein:
3.38 g
Fats:
0.62 g
Carbs:
19.94 g
Water:
75.63 g
Other:
0.43 g
Contains
more
Protein Protein
+162.1%
Contains
more
Fats Fats
+317.7%
Contains
more
Carbs Carbs
+37.5%
Contains
more
Other Other
+114%
Contains
more
Water Water
+25.6%
Fat Type Comparison
Fat type breakdown side-by-side comparison
2
13%
29%
58%
Saturated fat:
Sat. Fat
0.269 g
Monounsaturated fat:
Mono. Fat
0.583 g
Polyunsaturated fat:
Poly. Fat
1.156 g
1
26%
37%
37%
Saturated fat:
Sat. Fat
0.134 g
Monounsaturated fat:
Mono. Fat
0.188 g
Polyunsaturated fat:
Poly. Fat
0.188 g
Contains
more
Mono. Fat Monounsaturated fat
+210.1%
Contains
more
Poly. Fat Polyunsaturated fat
+514.9%
Contains
less
Sat. Fat Saturated fat
-50.2%