Chocolate cake vs. Crackers — In-Depth Nutrition Comparison
Compare
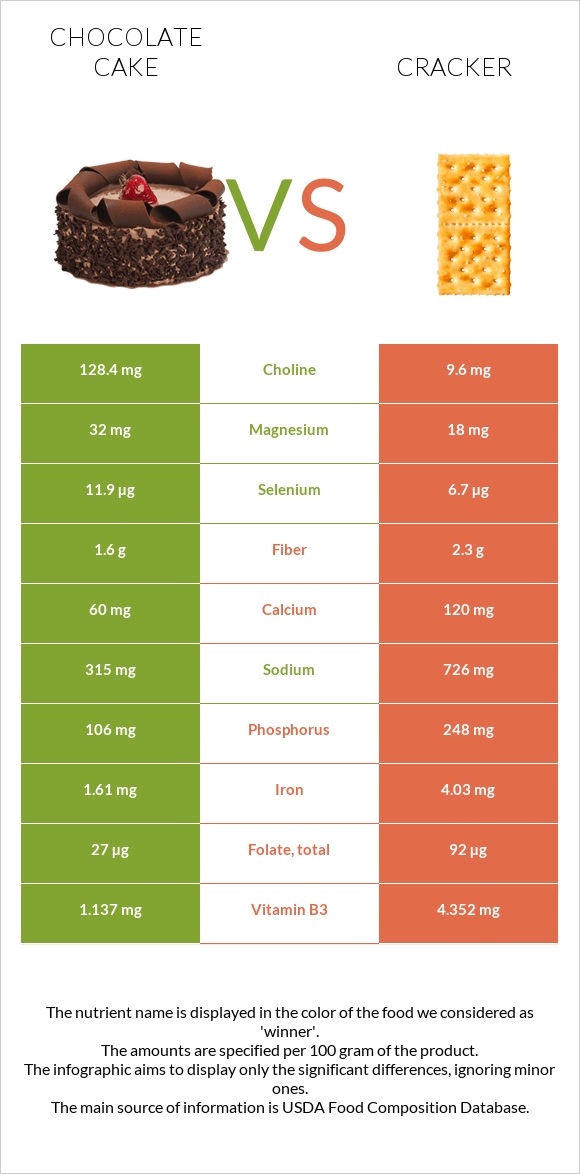
Significant differences between chocolate cake and crackers
- Chocolate cake has more choline and copper; however, crackers are richer in iron, vitamin B1, phosphorus, vitamin B3, vitamin B2, and folate.
- Crackers cover your daily iron needs 30% more than chocolate cake.
- Crackers have a higher glycemic index. The glycemic index of crackers is 63, while the glycemic index of chocolate cake is 41.
Specific food types used in this comparison are Cake, chocolate, prepared from recipe without frosting and Crackers, standard snack-type, regular.
Infographic
Infographic link
Mineral Comparison
Mineral comparison score is based on the number of minerals by which one or the other food is richer. The "coverage" charts below show how much of the daily needs can be covered by 300 grams of the food.
| Contains more MagnesiumMagnesium | +77.8% |
| Contains more PotassiumPotassium | +18.6% |
| Contains more CopperCopper | +99% |
| Contains more ZincZinc | +40.8% |
| Contains less SodiumSodium | -56.6% |
| Contains more SeleniumSelenium | +77.6% |
| Contains more CalciumCalcium | +100% |
| Contains more IronIron | +150.3% |
| Contains more PhosphorusPhosphorus | +134% |
| Contains more ManganeseManganese | +75.4% |
Vitamin Comparison
Vitamin comparison score is based on the number of vitamins by which one or the other food is richer. The "coverage" charts below show how much of the daily needs can be covered by 300 grams of the food.
| Contains more Vitamin CVitamin C | +∞% |
| Contains more Vitamin B12Vitamin B12 | +∞% |
| Contains more Vitamin B1Vitamin B1 | +195% |
| Contains more Vitamin B2Vitamin B2 | +114.1% |
| Contains more Vitamin B3Vitamin B3 | +282.8% |
| Contains more Vitamin B5Vitamin B5 | +37.2% |
| Contains more Vitamin B6Vitamin B6 | +53.7% |
| Contains more FolateFolate | +240.7% |
All nutrients comparison - raw data values
| Nutrient |  |
 |
DV% diff. |
| Polyunsaturated fat | 2.761g | 13.137g | 69% |
| Vitamin K | 69.3µg | 58% | |
| Iron | 1.61mg | 4.03mg | 30% |
| Vitamin B1 | 0.141mg | 0.416mg | 23% |
| Choline | 128.4mg | 9.6mg | 22% |
| Starch | 49.69g | 20% | |
| Phosphorus | 106mg | 248mg | 20% |
| Vitamin E | 3.03mg | 20% | |
| Vitamin B3 | 1.137mg | 4.352mg | 20% |
| Cholesterol | 58mg | 0mg | 19% |
| Vitamin B2 | 0.213mg | 0.456mg | 19% |
| Sodium | 315mg | 726mg | 18% |
| Fats | 15.1g | 26.43g | 17% |
| Folate | 27µg | 92µg | 16% |
| Copper | 0.207mg | 0.104mg | 11% |
| Manganese | 0.28mg | 0.491mg | 9% |
| Selenium | 11.9µg | 6.7µg | 9% |
| Calories | 371kcal | 510kcal | 7% |
| Vitamin B12 | 0.16µg | 0µg | 7% |
| Calcium | 60mg | 120mg | 6% |
| Protein | 5.3g | 6.64g | 3% |
| Carbs | 53.4g | 61.3g | 3% |
| Magnesium | 32mg | 18mg | 3% |
| Fiber | 1.6g | 2.3g | 3% |
| Zinc | 0.69mg | 0.49mg | 2% |
| Vitamin B5 | 0.304mg | 0.417mg | 2% |
| Vitamin B6 | 0.041mg | 0.063mg | 2% |
| Potassium | 140mg | 118mg | 1% |
| Saturated fat | 5.43g | 5.562g | 1% |
| Monounsaturated fat | 6.039g | 6.553g | 1% |
| Protein per 100 calories | 1.4g | 1.3g | N/A |
| Calories per 10 g protein | 700kcal | 768kcal | N/A |
| Weight per 100 calories | 27g | 20g | N/A |
| Unsaturated / Saturated Fat ratio | 1.6 | 3.5 | N/A |
| Vitamin C | 0.2mg | 0mg | 0% |
| Net carbs | 51.8g | 59g | N/A |
| Sugar | 8.18g | N/A | |
| Trans fat | 1.076g | N/A | |
| Tryptophan | 0.068mg | 0.084mg | 0% |
| Threonine | 0.202mg | 0.193mg | 0% |
| Isoleucine | 0.24mg | 0.246mg | 0% |
| Leucine | 0.407mg | 0.471mg | 0% |
| Lysine | 0.268mg | 0.103mg | 0% |
| Methionine | 0.116mg | 0.112mg | 0% |
| Phenylalanine | 0.265mg | 0.331mg | 0% |
| Valine | 0.283mg | 0.294mg | 0% |
| Histidine | 0.12mg | 0.145mg | 0% |
| Fructose | 0.29g | 0% | |
| Omega-3 - DHA | 0.005g | 0g | N/A |
| Omega-3 - ALA | 1.485g | N/A | |
| Omega-6 - Gamma-linoleic acid | 0.062g | N/A | |
| Omega-6 - Eicosadienoic acid | 0.009g | N/A | |
| Omega-6 - Linoleic acid | 11.48g | N/A |
Macronutrient Comparison
Macronutrient breakdown side-by-side comparison
Protein:
5.3 g
Fats:
15.1 g
Carbs:
53.4 g
Water:
24.4 g
Other:
1.8 g
Protein:
6.64 g
Fats:
26.43 g
Carbs:
61.3 g
Water:
3.14 g
Other:
2.49 g
| Contains more WaterWater | +677.1% |
| Contains more ProteinProtein | +25.3% |
| Contains more FatsFats | +75% |
| Contains more CarbsCarbs | +14.8% |
| Contains more OtherOther | +38.3% |
Fat Type Comparison
Fat type breakdown side-by-side comparison
Saturated fat:
Sat. Fat
5.43 g
Monounsaturated fat:
Mono. Fat
6.039 g
Polyunsaturated fat:
Poly. Fat
2.761 g
Saturated fat:
Sat. Fat
5.562 g
Monounsaturated fat:
Mono. Fat
6.553 g
Polyunsaturated fat:
Poly. Fat
13.137 g
| Contains more Poly. FatPolyunsaturated fat | +375.8% |
~equal in
Saturated fat
~5.562g
~equal in
Monounsaturated fat
~6.553g


