Chocolate eclair vs. Chocolate cake — In-Depth Nutrition Comparison
Compare
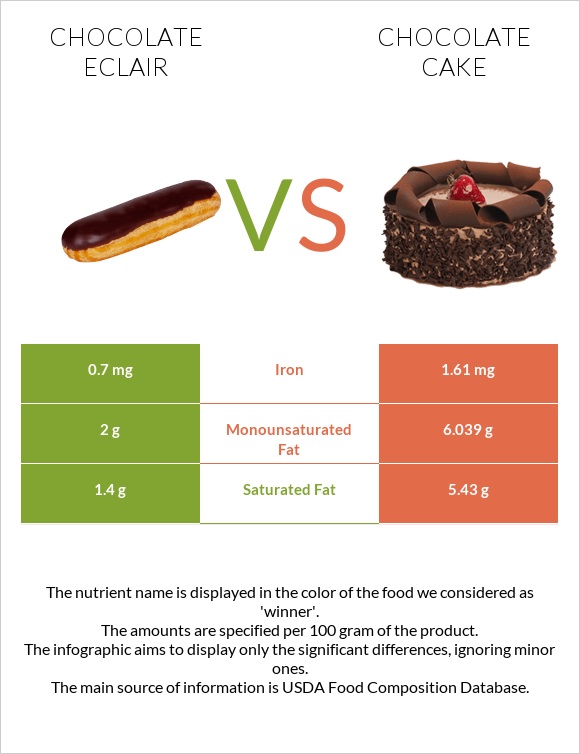
Differences between chocolate eclair and chocolate cake
- Chocolate cake is higher than chocolate eclair in iron and monounsaturated fat.
- Chocolate cake's daily need coverage for saturated fat is 20% higher.
- Chocolate eclair has less saturated fat.
The food types used in this comparison are HEINZ, WEIGHT WATCHER, Chocolate Eclair, frozen and Cake, chocolate, prepared from recipe without frosting.
Infographic
Infographic link
Mineral Comparison
Mineral comparison score is based on the number of minerals by which one or the other food is richer. The "coverage" charts below show how much of the daily needs can be covered by 300 grams of the food.
| Contains more CalciumCalcium | +25% |
| Contains more IronIron | +130% |
Vitamin Comparison
Vitamin comparison score is based on the number of vitamins by which one or the other food is richer. The "coverage" charts below show how much of the daily needs can be covered by 300 grams of the food.
| Contains more Vitamin CVitamin C | +∞% |
All nutrients comparison - raw data values
| Nutrient |  |
 |
DV% diff. |
| Copper | 0.207mg | 23% | |
| Choline | 128.4mg | 23% | |
| Selenium | 11.9µg | 22% | |
| Saturated fat | 1.4g | 5.43g | 18% |
| Vitamin B2 | 0.213mg | 16% | |
| Phosphorus | 106mg | 15% | |
| Fats | 6.9g | 15.1g | 13% |
| Manganese | 0.28mg | 12% | |
| Vitamin B1 | 0.141mg | 12% | |
| Iron | 0.7mg | 1.61mg | 11% |
| Monounsaturated fat | 2g | 6.039g | 10% |
| Magnesium | 32mg | 8% | |
| Calories | 241kcal | 371kcal | 7% |
| Vitamin B3 | 1.137mg | 7% | |
| Vitamin B12 | 0.16µg | 7% | |
| Folate | 27µg | 7% | |
| Zinc | 0.69mg | 6% | |
| Vitamin B5 | 0.304mg | 6% | |
| Carbs | 40.3g | 53.4g | 4% |
| Cholesterol | 47mg | 58mg | 4% |
| Potassium | 140mg | 4% | |
| Vitamin B6 | 0.041mg | 3% | |
| Protein | 4.4g | 5.3g | 2% |
| Fiber | 2.1g | 1.6g | 2% |
| Calcium | 48mg | 60mg | 1% |
| Sodium | 300mg | 315mg | 1% |
| Polyunsaturated fat | 2.9g | 2.761g | 1% |
| Vitamin C | 0mg | 0.2mg | 0% |
| Net carbs | 38.2g | 51.8g | N/A |
| Sugar | 16.8g | N/A | |
| Trans fat | 0.2g | N/A | |
| Tryptophan | 0.068mg | 0% | |
| Threonine | 0.202mg | 0% | |
| Isoleucine | 0.24mg | 0% | |
| Leucine | 0.407mg | 0% | |
| Lysine | 0.268mg | 0% | |
| Methionine | 0.116mg | 0% | |
| Phenylalanine | 0.265mg | 0% | |
| Valine | 0.283mg | 0% | |
| Histidine | 0.12mg | 0% | |
| Omega-3 - DHA | 0.005g | N/A |
Macronutrient Comparison
Macronutrient breakdown side-by-side comparison
Protein:
4.4 g
Fats:
6.9 g
Carbs:
40.3 g
Water:
47.3 g
Other:
1.1 g
Protein:
5.3 g
Fats:
15.1 g
Carbs:
53.4 g
Water:
24.4 g
Other:
1.8 g
| Contains more WaterWater | +93.9% |
| Contains more ProteinProtein | +20.5% |
| Contains more FatsFats | +118.8% |
| Contains more CarbsCarbs | +32.5% |
| Contains more OtherOther | +63.6% |
Fat Type Comparison
Fat type breakdown side-by-side comparison
Saturated fat:
Sat. Fat
1.4 g
Monounsaturated fat:
Mono. Fat
2 g
Polyunsaturated fat:
Poly. Fat
2.9 g
Saturated fat:
Sat. Fat
5.43 g
Monounsaturated fat:
Mono. Fat
6.039 g
Polyunsaturated fat:
Poly. Fat
2.761 g
| Contains less Sat. FatSaturated fat | -74.2% |
| Contains more Mono. FatMonounsaturated fat | +202% |
~equal in
Polyunsaturated fat
~2.761g


