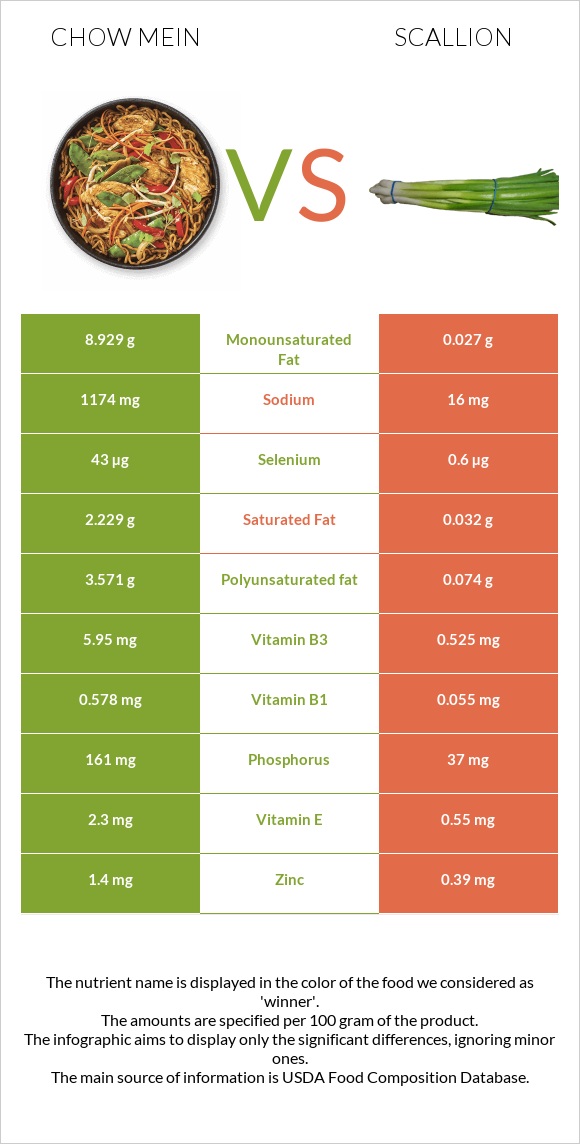
The main differences between chow mein and scallions Chow mein has more selenium, vitamin B1, iron, vitamin B3, vitamin B2, and phosphorus; however, scallions have more vitamin K, vitamin C, and vitamin A. Daily need coverage for vitamin K for scallions is 171% higher. Scallions have 73 times less sodium than chow mein. Chow mein has 1174mg of sodium, while scallions have 16mg. Chow mein has a higher glycemic index than scallions. Food types used in this article are Noodles, chinese, chow mein and Onions, spring or scallions (includes tops and bulb), raw .
Infographic
Mineral Comparison
Mineral comparison score is based on the number of minerals by which one or the other food is richer. The "coverage" charts below show how much of the daily needs can be covered by 300 grams of the food.
6
100 g
300 g
0.5 cup dry - 28g 1.5 oz - 43g
Magnesium
Magnesium
Calcium
Calcium
Potassium
Potassium
Iron
Iron
Copper
Copper
Zinc
Zinc
Phosphorus
Phosphorus
Sodium
Sodium
Manganese
Manganese
Selenium
Selenium
37%
6%
11%
177%
56%
38%
69%
153%
0%
235%
4
100 g
300 g
1 small (3" long) - 5g 1 tbsp chopped - 6g 1 medium (4-1/8" long) - 15g 1 large - 25g
Magnesium
Magnesium
Calcium
Calcium
Potassium
Potassium
Iron
Iron
Copper
Copper
Zinc
Zinc
Phosphorus
Phosphorus
Sodium
Sodium
Manganese
Manganese
Selenium
Selenium
14%
22%
24%
56%
28%
11%
16%
2.1%
21%
3.3%
Vitamin Comparison
Vitamin comparison score is based on the number of vitamins by which one or the other food is richer. The "coverage" charts below show how much of the daily needs can be covered by 300 grams of the food.
7
100 g
300 g
0.5 cup dry - 28g 1.5 oz - 43g
Vitamin C
Vit. C
Vitamin D
Vit. D
Vitamin A
Vit. A
Vitamin E
Vit. E
Vitamin B1
Vit. B1
Vitamin B2
Vit. B2
Vitamin B3
Vit. B3
Vitamin B5
Vit. B5
Vitamin B6
Vit. B6
Vitamin B12
Vit. B12
Vitamin K
Vit. K
Folate
Folate
0%
0%
0%
46%
145%
97%
112%
32%
25%
0%
3.5%
80%
3
100 g
300 g
1 small (3" long) - 5g 1 tbsp chopped - 6g 1 medium (4-1/8" long) - 15g 1 large - 25g
Vitamin C
Vit. C
Vitamin D
Vit. D
Vitamin A
Vit. A
Vitamin E
Vit. E
Vitamin B1
Vit. B1
Vitamin B2
Vit. B2
Vitamin B3
Vit. B3
Vitamin B5
Vit. B5
Vitamin B6
Vit. B6
Vitamin B12
Vit. B12
Vitamin K
Vit. K
Folate
Folate
63%
0%
17%
11%
14%
18%
9.8%
4.5%
14%
0%
518%
48%
All nutrients comparison - raw data values
Nutrient
DV% diff.
Vitamin K
1.4µg
207µg
171%
Selenium
43µg
0.6µg
77%
Sodium
1174mg
16mg
50%
Vitamin B1
0.578mg
0.055mg
44%
Iron
4.73mg
1.48mg
41%
Vitamin B3
5.95mg
0.525mg
34%
Vitamin B2
0.421mg
0.08mg
26%
Fats
15.43g
0.19g
23%
Polyunsaturated fat
3.571g
0.074g
23%
Calories
475kcal
32kcal
22%
Carbs
72.8g
7.34g
22%
Monounsaturated fat
8.929g
0.027g
22%
Vitamin C
0mg
18.8mg
21%
Phosphorus
161mg
37mg
18%
Protein
8.11g
1.83g
13%
Vitamin E
2.3mg
0.55mg
12%
Folate
106µg
64µg
11%
Saturated fat
2.229g
0.032g
10%
Copper
0.167mg
0.083mg
9%
Zinc
1.4mg
0.39mg
9%
Vitamin B5
0.533mg
0.075mg
9%
Magnesium
52mg
20mg
8%
Manganese
0.16mg
7%
Vitamin A
0µg
50µg
6%
Calcium
20mg
72mg
5%
Potassium
120mg
276mg
5%
Fiber
3.7g
2.6g
4%
Vitamin B6
0.11mg
0.061mg
4%
Choline
8.7mg
5.7mg
1%
Protein per 100 calories
1.7g
5.7g
N/A
Calories per 10 g protein
586kcal
175kcal
N/A
Weight per 100 calories
21g
313g
N/A
Unsaturated / Saturated Fat ratio
5.6
3.2
N/A
Net carbs
69.1g
4.74g
N/A
Sugar
5.71g
2.33g
N/A
Trans fat
0.8g
0g
N/A
Tryptophan
0.02mg
0%
Threonine
0.072mg
0%
Isoleucine
0.077mg
0%
Leucine
0.109mg
0%
Lysine
0.091mg
0%
Methionine
0.02mg
0%
Phenylalanine
0.059mg
0%
Valine
0.081mg
0%
Histidine
0.032mg
0%
Macronutrient Comparison
Macronutrient breakdown side-by-side comparison
4
8%
15%
73%
2%
Protein:
8.11 g
Fats:
15.43 g
Carbs:
72.8 g
Water:
1.18 g
Other:
2.48 g
1
2%
7%
90%
Protein:
1.83 g
Fats:
0.19 g
Carbs:
7.34 g
Water:
89.83 g
Other:
0.81 g
Contains
more
Protein Protein
+343.2%
Contains
more
Fats Fats
+8021.1%
Contains
more
Carbs Carbs
+891.8%
Contains
more
Other Other
+206.2%
Contains
more
Water Water
+7512.7%
Fat Type Comparison
Fat type breakdown side-by-side comparison
2
15%
61%
24%
Saturated fat:
Sat. Fat
2.229 g
Monounsaturated fat:
Mono. Fat
8.929 g
Polyunsaturated fat:
Poly. Fat
3.571 g
1
24%
20%
56%
Saturated fat:
Sat. Fat
0.032 g
Monounsaturated fat:
Mono. Fat
0.027 g
Polyunsaturated fat:
Poly. Fat
0.074 g
Contains
more
Mono. Fat Monounsaturated fat
+32970.4%
Contains
more
Poly. Fat Polyunsaturated fat
+4725.7%
Contains
less
Sat. Fat Saturated fat
-98.6%