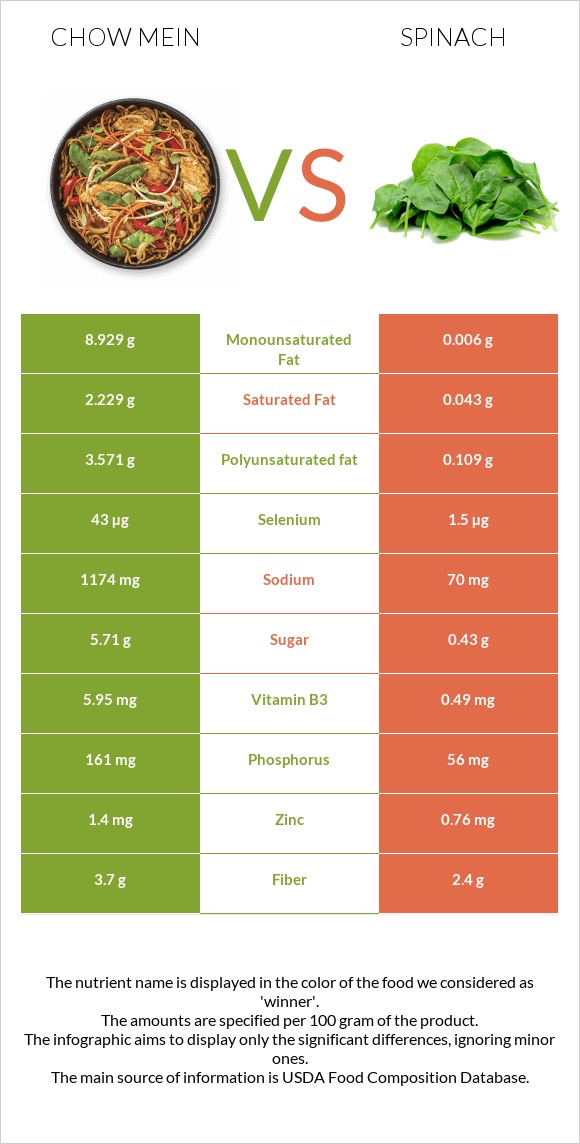
Differences between chow mein and spinach Chow mein has more selenium, vitamin B1, vitamin B3, phosphorus, iron, and vitamin B2, while spinach has more vitamin K, vitamin A, and calcium. Spinach's daily need coverage for vitamin K is 410% higher. Spinach contains 29 times less selenium than chow mein. Chow mein contains 43µg of selenium, while spinach contains 1.5µg. The amount of sodium in spinach is lower. Spinach has a lower glycemic index. The glycemic index of spinach is 32, while the glycemic index of chow mein is 47. The food types used in this comparison are Noodles, chinese, chow mein and Spinach, cooked, boiled, drained, without salt .
Infographic
Mineral Comparison
Mineral comparison score is based on the number of minerals by which one or the other food is richer. The "coverage" charts below show how much of the daily needs can be covered by 300 grams of the food.
4
100 g
300 g
0.5 cup dry - 28g 1.5 oz - 43g
Magnesium
Magnesium
Calcium
Calcium
Potassium
Potassium
Iron
Iron
Copper
Copper
Zinc
Zinc
Phosphorus
Phosphorus
Sodium
Sodium
Manganese
Manganese
Selenium
Selenium
37%
6%
11%
177%
56%
38%
69%
153%
0%
235%
5
100 g
300 g
1 cup - 180g
Magnesium
Magnesium
Calcium
Calcium
Potassium
Potassium
Iron
Iron
Copper
Copper
Zinc
Zinc
Phosphorus
Phosphorus
Sodium
Sodium
Manganese
Manganese
Selenium
Selenium
62%
41%
41%
134%
58%
21%
24%
9.1%
122%
8.2%
Vitamin Comparison
Vitamin comparison score is based on the number of vitamins by which one or the other food is richer. The "coverage" charts below show how much of the daily needs can be covered by 300 grams of the food.
4
100 g
300 g
0.5 cup dry - 28g 1.5 oz - 43g
Vitamin C
Vit. C
Vitamin D
Vit. D
Vitamin A
Vit. A
Vitamin E
Vit. E
Vitamin B1
Vit. B1
Vitamin B2
Vit. B2
Vitamin B3
Vit. B3
Vitamin B5
Vit. B5
Vitamin B6
Vit. B6
Vitamin B12
Vit. B12
Vitamin K
Vit. K
Folate
Folate
0%
0%
0%
46%
145%
97%
112%
32%
25%
0%
3.5%
80%
5
100 g
300 g
1 cup - 180g
Vitamin C
Vit. C
Vitamin D
Vit. D
Vitamin A
Vit. A
Vitamin E
Vit. E
Vitamin B1
Vit. B1
Vitamin B2
Vit. B2
Vitamin B3
Vit. B3
Vitamin B5
Vit. B5
Vitamin B6
Vit. B6
Vitamin B12
Vit. B12
Vitamin K
Vit. K
Folate
Folate
33%
0%
175%
42%
24%
54%
9.2%
8.7%
56%
0%
1234%
110%
All nutrients comparison - raw data values
Nutrient
DV% diff.
Vitamin K
1.4µg
493.6µg
410%
Selenium
43µg
1.5µg
75%
Vitamin A
0µg
524µg
58%
Sodium
1174mg
70mg
48%
Manganese
0.935mg
41%
Vitamin B1
0.578mg
0.095mg
40%
Vitamin B3
5.95mg
0.49mg
34%
Calories
475kcal
23kcal
23%
Fats
15.43g
0.26g
23%
Carbs
72.8g
3.75g
23%
Polyunsaturated fat
3.571g
0.109g
23%
Monounsaturated fat
8.929g
0.006g
22%
Iron
4.73mg
3.57mg
15%
Phosphorus
161mg
56mg
15%
Vitamin B2
0.421mg
0.236mg
14%
Calcium
20mg
136mg
12%
Vitamin C
0mg
9.8mg
11%
Protein
8.11g
2.97g
10%
Potassium
120mg
466mg
10%
Vitamin B6
0.11mg
0.242mg
10%
Folate
106µg
146µg
10%
Saturated fat
2.229g
0.043g
10%
Magnesium
52mg
87mg
8%
Vitamin B5
0.533mg
0.145mg
8%
Zinc
1.4mg
0.76mg
6%
Fiber
3.7g
2.4g
5%
Choline
8.7mg
19.7mg
2%
Copper
0.167mg
0.174mg
1%
Vitamin E
2.3mg
2.08mg
1%
Protein per 100 calories
1.7g
13g
N/A
Calories per 10 g protein
586kcal
77kcal
N/A
Weight per 100 calories
21g
435g
N/A
Unsaturated / Saturated Fat ratio
5.6
2.7
N/A
Net carbs
69.1g
1.35g
N/A
Sugar
5.71g
0.43g
N/A
Trans fat
0.8g
0g
N/A
Tryptophan
0.04mg
0%
Threonine
0.127mg
0%
Isoleucine
0.152mg
0%
Leucine
0.231mg
0%
Lysine
0.182mg
0%
Methionine
0.055mg
0%
Phenylalanine
0.134mg
0%
Valine
0.168mg
0%
Histidine
0.066mg
0%
Macronutrient Comparison
Macronutrient breakdown side-by-side comparison
4
8%
15%
73%
2%
Protein:
8.11 g
Fats:
15.43 g
Carbs:
72.8 g
Water:
1.18 g
Other:
2.48 g
1
3%
4%
91%
2%
Protein:
2.97 g
Fats:
0.26 g
Carbs:
3.75 g
Water:
91.21 g
Other:
1.81 g
Contains
more
Protein Protein
+173.1%
Contains
more
Fats Fats
+5834.6%
Contains
more
Carbs Carbs
+1841.3%
Contains
more
Other Other
+37%
Contains
more
Water Water
+7629.7%
Fat Type Comparison
Fat type breakdown side-by-side comparison
2
15%
61%
24%
Saturated fat:
Sat. Fat
2.229 g
Monounsaturated fat:
Mono. Fat
8.929 g
Polyunsaturated fat:
Poly. Fat
3.571 g
1
27%
4%
69%
Saturated fat:
Sat. Fat
0.043 g
Monounsaturated fat:
Mono. Fat
0.006 g
Polyunsaturated fat:
Poly. Fat
0.109 g
Contains
more
Mono. Fat Monounsaturated fat
+148716.7%
Contains
more
Poly. Fat Polyunsaturated fat
+3176.1%
Contains
less
Sat. Fat Saturated fat
-98.1%