Cod vs. Mahimahi — Health Impact and Nutrition Comparison


Summary
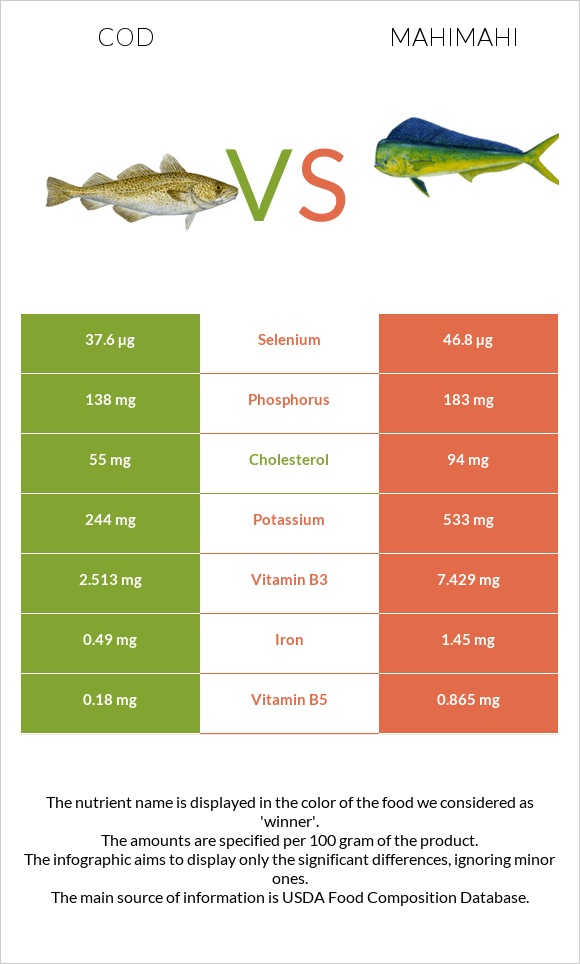
Two worldwide famous fish species, cod and mahi mahi, have many differences in nutritional profile. Cod is higher in phosphorus, B-complex vitamins, and selenium. Mahi mahi contains more cholesterol, vitamin A, and higher calories. Two species provide different compounds to promote heart health.
Introduction
Cod and mahi mahi are two of the most famous and widespread fishes. In this article, we will compare these species, focusing on their nutritional profile and health impact, and discussing their actual differences.
Actual differences
Cod (1) is a common name for a demersal fish from the genus Gadus. It is usually consumed in grilled, baked, deep-fried, or broiled form. Cod has a non-fishy, mild, and a bit sweet taste. It is widespread in the Atlantic and Pacific areas. You can easily find cod in markets, frozen or fresh.
Mahi mahi (2) is a yellow or bright-green predatory fish mostly consumed in Hawaii. However, it can be found and used worldwide. In another way, this fish is called a dolphinfish or dorado. Mahi mahi has a mild, sweeter, and non-fishy flavor. It is usually fried with herbs, lemon, and spices. The fish lives in the Gulf of Mexico and the Caribbean sea.
Nutrition
In this part of the article, we will discuss the macronutrient, vitamin, and mineral composition of cod and mahi mahi. Both of them are nutritious fish without any amounts of carbs.
Macronutrient Comparison
Contains
more
OtherOther
+966.7%
Protein
Mahi-mahi is slightly richer in protein than cod. Per 100g serving, cod provides 22.8g of protein, while mahi mahi contains 23.7g of it.
Both of them are good sources of essential amino acids.
Fat
Cod and mahi mahi provide less than one gram of fat per 100g.
Surprisingly, mahi mahi is 39mg higher in cholesterol than cod.
Fat Type Comparison
Contains
less
Sat. FatSaturated fat
-30.3%
Contains
more
Poly. FatPolyunsaturated fat
+38.4%
Contains
more
Mono. FatMonounsaturated fat
+25%
Calories
Due to its higher protein composition, mahi mahi provides slightly more calories than cod.
Minerals
When looking at the mineral comparison chart shown below, it is clear that both mahi mahi and cod are high in different minerals.
Mahi mahi provides more iron and copper than cod. Cod contains more magnesium and less sodium. Cod is packed with selenium. Mahi mahi is rich in mercury.
Mineral Comparison
Contains
less
SodiumSodium
-31%
Contains
more
CalciumCalcium
+35.7%
Contains
more
PotassiumPotassium
+118.4%
Contains
more
IronIron
+195.9%
Contains
more
CopperCopper
+47.2%
Contains
more
PhosphorusPhosphorus
+32.6%
Contains
more
SeleniumSelenium
+24.5%
Vitamins
Cod is the winner in terms of vitamin content. It is richer in B1, and B12 vitamins, vitamin C, and folate. Mahi mahi contains more vitamin A.
Vitamin Comparison
Contains
more
Vitamin CVitamin C
+∞%
Contains
more
Vitamin DVitamin D
+∞%
Contains
more
Vitamin EVitamin E
+∞%
Contains
more
Vitamin B1Vitamin B1
+282.6%
Contains
more
Vitamin B12Vitamin B12
+52.2%
Contains
more
Vitamin KVitamin K
+∞%
Contains
more
FolateFolate
+33.3%
Contains
more
Vitamin AVitamin A
+342.9%
Contains
more
Vitamin B3Vitamin B3
+195.6%
Contains
more
Vitamin B5Vitamin B5
+380.6%
Contains
more
Vitamin B6Vitamin B6
+63.3%
Health impact
Cardiovascular health
Cod and mahi mahi consumption is linked to a lower heart disease risk (3). This is due to omega-3 fatty acid composition. These are long-chain essential fatty acids that are not produced in the human organism. Hence we should get them with the food we consume.
Health risks
Mahi mahi is classified as food with moderate amounts of mercury. Although this mineral is not toxic for healthy middle-aged people, it can harm young people, children, and pregnant women (4). Avoiding excessive fish consumption to prevent mercury poisoning would be best. Cod is lower in mercury than mahi mahi, making itself a better choice to avoid mercury poisoning (5).
Cod can be a source of parasites if consumed raw without cooking or freezing (6).
References
- https://fdc.nal.usda.gov/fdc-app.html#/food-details/171955/nutrients
- https://fdc.nal.usda.gov/fdc-app.html#/food-details/171959/nutrients
- https://www.ncbi.nlm.nih.gov/pmc/articles/PMC7468748/
- https://www.ncbi.nlm.nih.gov/pmc/articles/PMC2954077/
- https://www.fda.gov/food/metals-and-your-food/mercury-levels-commercial-fish-and-shellfish-1990-2012
- https://nap.nationalacademies.org/read/11762/chapter/6#167

Infographic
All nutrients comparison - raw data values
| Nutrient | |
|
DV% diff. |
| Vitamin B3 | 2.513mg | 7.429mg | 31% |
| Selenium | 37.6µg | 46.8µg | 17% |
| Vitamin B12 | 1.05µg | 0.69µg | 15% |
| Choline | 83.7mg | 15% | |
| Vitamin B5 | 0.18mg | 0.865mg | 14% |
| Vitamin B6 | 0.283mg | 0.462mg | 14% |
| Cholesterol | 55mg | 94mg | 13% |
| Iron | 0.49mg | 1.45mg | 12% |
| Potassium | 244mg | 533mg | 9% |
| Vitamin D* | 46 IU | 6% | |
| Vitamin D | 1.2µg | 6% | |
| Phosphorus | 138mg | 183mg | 6% |
| Vitamin A | 14µg | 62µg | 5% |
| Vitamin E | 0.81mg | 5% | |
| Vitamin B1 | 0.088mg | 0.023mg | 5% |
| Protein | 22.83g | 23.72g | 2% |
| Copper | 0.036mg | 0.053mg | 2% |
| Sodium | 78mg | 113mg | 2% |
| Vitamin C | 1mg | 0mg | 1% |
| Magnesium | 42mg | 38mg | 1% |
| Calcium | 14mg | 19mg | 1% |
| Folate | 8µg | 6µg | 1% |
| Polyunsaturated fat | 0.292g | 0.211g | 1% |
| Calories | 105kcal | 109kcal | 0% |
| Protein per 100 calories | 22g | 22g | N/A |
| Calories per 10 g protein | 46kcal | 46kcal | N/A |
| Weight per 100 calories | 95g | 92g | N/A |
| Fats | 0.86g | 0.9g | 0% |
| Zinc | 0.58mg | 0.59mg | 0% |
| Manganese | 0.02mg | 0.019mg | 0% |
| Vitamin B2 | 0.079mg | 0.085mg | 0% |
| Vitamin K | 0.1µg | 0% | |
| Saturated fat | 0.168g | 0.241g | 0% |
| Monounsaturated fat | 0.124g | 0.155g | 0% |
| Tryptophan | 0.256mg | 0.266mg | 0% |
| Threonine | 1.001mg | 1.04mg | 0% |
| Isoleucine | 1.052mg | 1.093mg | 0% |
| Leucine | 1.856mg | 1.928mg | 0% |
| Lysine | 2.097mg | 2.178mg | 0% |
| Methionine | 0.676mg | 0.702mg | 0% |
| Phenylalanine | 0.891mg | 0.926mg | 0% |
| Valine | 1.176mg | 1.222mg | 0% |
| Histidine | 0.672mg | 0.698mg | 0% |
| Omega-3 - EPA | 0.004g | 0.026g | N/A |
| Omega-3 - DHA | 0.154g | 0.113g | N/A |
| Omega-3 - DPA | 0.013g | 0.012g | N/A |
People also compare


References
All the values for which the sources are not specified explicitly are taken from FDA’s Food Central. The exact link to the food presented on this page can be found below.
- Cod - https://fdc.nal.usda.gov/fdc-app.html#/food-details/171956/nutrients
- Mahimahi - https://fdc.nal.usda.gov/fdc-app.html#/food-details/171992/nutrients
All the Daily Values are presented for males aged 31-50, for 2000-calorie diets.