Plum vs. Radish — In-Depth Nutrition Comparison
Compare
How are plums and radish different?
- Plums have more vitamin A; however, radish is richer in vitamin C.
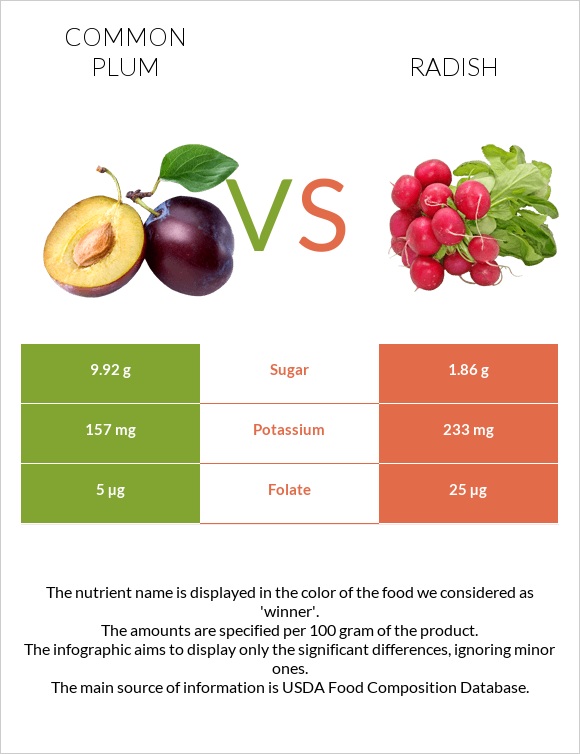
- Plums have 5 times more sugar than radish. Plums have 9.92g of sugar, while radish has 1.86g.
- Plums have a higher glycemic index. The glycemic index of plums is 53, while the glycemic index of radish is 32.
Plums, raw and Radishes, raw types were used in this article.
Infographic
Infographic link
Mineral Comparison
Mineral comparison score is based on the number of minerals by which one or the other food is richer. The "coverage" charts below show how much of the daily needs can be covered by 300 grams of the food.
| Contains more CopperCopper | +14% |
| Contains less SodiumSodium | -100% |
| Contains more MagnesiumMagnesium | +42.9% |
| Contains more CalciumCalcium | +316.7% |
| Contains more PotassiumPotassium | +48.4% |
| Contains more IronIron | +100% |
| Contains more ZincZinc | +180% |
| Contains more PhosphorusPhosphorus | +25% |
| Contains more ManganeseManganese | +32.7% |
| Contains more SeleniumSelenium | +∞% |
Vitamin Comparison
Vitamin comparison score is based on the number of vitamins by which one or the other food is richer. The "coverage" charts below show how much of the daily needs can be covered by 300 grams of the food.
| Contains more Vitamin AVitamin A | +∞% |
| Contains more Vitamin EVitamin E | +∞% |
| Contains more Vitamin B1Vitamin B1 | +133.3% |
| Contains more Vitamin B3Vitamin B3 | +64.2% |
| Contains more Vitamin KVitamin K | +392.3% |
| Contains more Vitamin CVitamin C | +55.8% |
| Contains more Vitamin B2Vitamin B2 | +50% |
| Contains more Vitamin B5Vitamin B5 | +22.2% |
| Contains more Vitamin B6Vitamin B6 | +144.8% |
| Contains more FolateFolate | +400% |
All nutrients comparison - raw data values
| Nutrient |  |
 |
DV% diff. |
| Vitamin C | 9.5mg | 14.8mg | 6% |
| Folate | 5µg | 25µg | 5% |
| Vitamin K | 6.4µg | 1.3µg | 4% |
| Carbs | 11.42g | 3.4g | 3% |
| Vitamin B6 | 0.029mg | 0.071mg | 3% |
| Fructose | 3.07g | 0.71g | 3% |
| Calories | 46kcal | 16kcal | 2% |
| Calcium | 6mg | 25mg | 2% |
| Potassium | 157mg | 233mg | 2% |
| Iron | 0.17mg | 0.34mg | 2% |
| Zinc | 0.1mg | 0.28mg | 2% |
| Sodium | 0mg | 39mg | 2% |
| Vitamin A | 17µg | 0µg | 2% |
| Vitamin E | 0.26mg | 0mg | 2% |
| Magnesium | 7mg | 10mg | 1% |
| Fiber | 1.4g | 1.6g | 1% |
| Copper | 0.057mg | 0.05mg | 1% |
| Phosphorus | 16mg | 20mg | 1% |
| Manganese | 0.052mg | 0.069mg | 1% |
| Selenium | 0µg | 0.6µg | 1% |
| Vitamin B1 | 0.028mg | 0.012mg | 1% |
| Vitamin B2 | 0.026mg | 0.039mg | 1% |
| Vitamin B3 | 0.417mg | 0.254mg | 1% |
| Vitamin B5 | 0.135mg | 0.165mg | 1% |
| Choline | 1.9mg | 6.5mg | 1% |
| Protein | 0.7g | 0.68g | 0% |
| Fats | 0.28g | 0.1g | 0% |
| Net carbs | 10.02g | 1.8g | N/A |
| Sugar | 9.92g | 1.86g | N/A |
| Saturated fat | 0.017g | 0.032g | 0% |
| Monounsaturated fat | 0.134g | 0.017g | 0% |
| Polyunsaturated fat | 0.044g | 0.048g | 0% |
| Tryptophan | 0.009mg | 0.009mg | 0% |
| Threonine | 0.01mg | 0.023mg | 0% |
| Isoleucine | 0.014mg | 0.02mg | 0% |
| Leucine | 0.015mg | 0.031mg | 0% |
| Lysine | 0.016mg | 0.033mg | 0% |
| Methionine | 0.008mg | 0.01mg | 0% |
| Phenylalanine | 0.014mg | 0.036mg | 0% |
| Valine | 0.016mg | 0.035mg | 0% |
| Histidine | 0.009mg | 0.013mg | 0% |
Macronutrient Comparison
Macronutrient breakdown side-by-side comparison
| Contains more FatsFats | +180% |
| Contains more CarbsCarbs | +235.9% |
| Contains more OtherOther | +48.6% |
~equal in
Protein
~0.68g
~equal in
Water
~95.27g
Fat Type Comparison
Fat type breakdown side-by-side comparison
| Contains less Sat. FatSaturated fat | -46.9% |
| Contains more Mono. FatMonounsaturated fat | +688.2% |
~equal in
Polyunsaturated fat
~0.048g
Carbohydrate type comparison
Carbohydrate type breakdown side-by-side comparison
| Contains more SucroseSucrose | +1470% |
| Contains more GlucoseGlucose | +382.9% |
| Contains more FructoseFructose | +332.4% |
| Contains more MaltoseMaltose | +∞% |
| Contains more GalactoseGalactose | +∞% |
~equal in
Starch
~0g
~equal in
Lactose
~0g


