Radish nutrition: calories, carbs, GI, protein, fiber, fats
Carbs in Radish
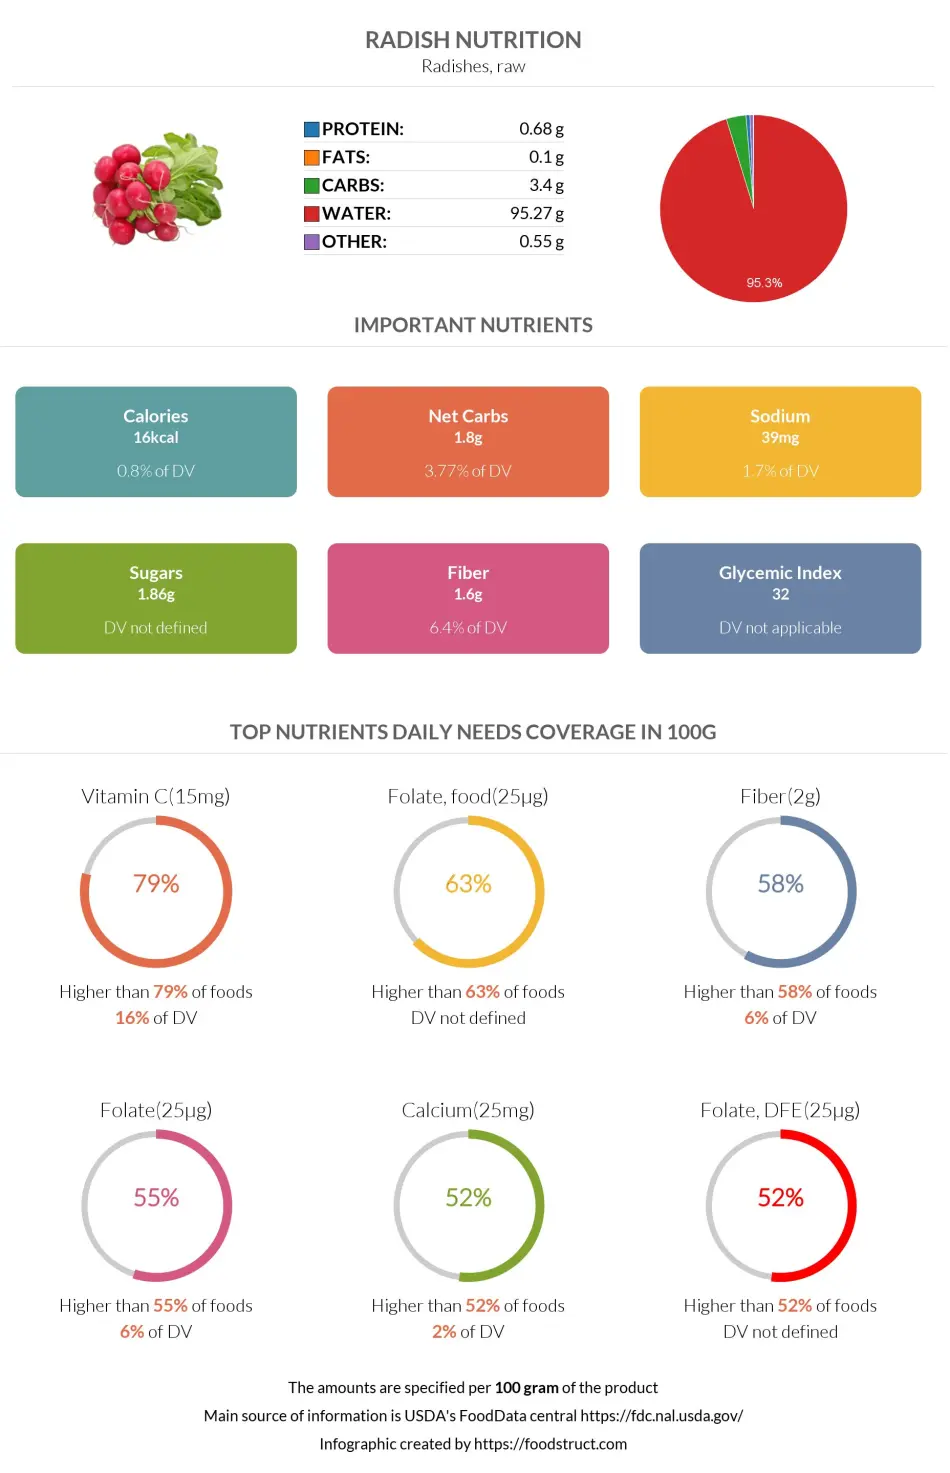
Unlike most root vegetables, radish is significantly low in carbs. A 100g of this food comprises 95% water, 3% carbohydrates, and 2% other nutrients.
Carbohydrates per 100g
Radish provides 3.4g of carbs per 100g.
This amount is equal to 1% of the DV of carbohydrates.
According to our database, radish is lower in carbs than 65% of other foods.
Macronutrients chart
Carbs per serving size
The serving size for radish is one medium(3/4" to 1" dia), which equals 4.5 grams. One serving of this vegetable contains only 0.15g of carbs.
Carbohydrate type breakdown
Nearly half of the overall carbohydrates in Radish are fibers, equalling 1.6g.
The other 1.8g are sugars, consisting of 1.05g of glucose, 0.71g of fructose, and 0.1g of sucrose.
The distribution of different types of carbs is shown in the chart below.
Carbohydrate type breakdown
Carbs of different types
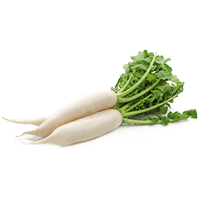
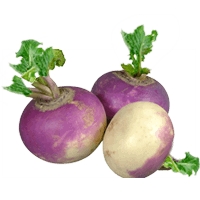
Carbohydrates in different types of radish can vary.
The carbs below are presented for 100g of radish products using the USDA's data source (1, 2, 3).
| Carbs per 100g | |
| Oriental dried radish | 63.4g |
| White icicle raw radish | 2.63g |
| Oriental cooked and drained radish without salt | 3.43g |
Soluble and insoluble fiber
Although radish contains both types of dietary fibers, it is especially rich in lignin. This is a type of insoluble fiber.
Fiber content ratio for Radish
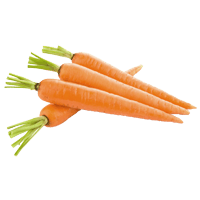
What Do 16 Calories or 100 Grams of Radish Look Like?
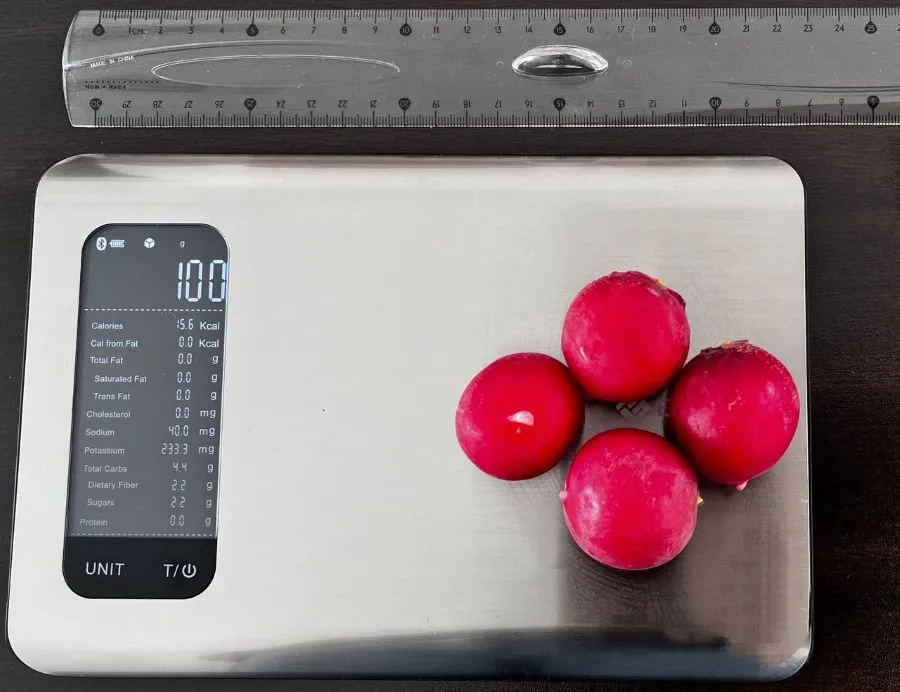
We measured what 100 grams of radish looks like to help you visualize its weight and calories. As you can see from the picture above, about four radishes made up the entire 100 grams, which means one radish was about 25 grams or about 4 calories.
Comparison to other foods
Radish glycemic index
Like most non-starchy vegetables, radishes are very low in carbohydrates. Because of this, calculating an exact number for the glycemic index of radishes is a difficult issue.
Radish roots are rich in dietary fiber and minerals, such as magnesium and zinc, which are obligatory cofactors for enzymes that improve glucose metabolism and insulin signaling pathways (3).
By enhancing the antioxidant defense mechanism, decreasing oxidative stress, improving hormone-induced glucose homeostasis, promoting glucose uptake and energy metabolism, and reducing glucose absorption in the intestines, radish roots have expressed significant antidiabetic properties and appear favorable in diabetic conditions (4).
However, the beneficial properties of food can change significantly based on the method of its use. Like so, Chinese radish cake, pan-fried and with plain rice flour, has a high glycemic index of 77 (5).
All in all, radish can be safely recommended for people with diabetes, as it's part of a healthy, balanced diet.
References
- https://fdc.nal.usda.gov/fdc-app.html#/food-details/168453/nutrients
- https://fdc.nal.usda.gov/fdc-app.html#/food-details/170081/nutrients
- https://fdc.nal.usda.gov/fdc-app.html#/food-details/168452/nutrients
- https://www.hindawi.com/journals/bmri/2019/7425367/
- https://www.ncbi.nlm.nih.gov/pmc/articles/PMC5622774/
- Glycaemic index and glycaemic load of selected popular foods consumed

Top nutrition facts for Radish
| Calories ⓘ Calories for selected serving | 16 kcal |
| Glycemic index ⓘ Gi values are taken from various scientific sources. GI values less than 55 are considered as low. Values above 70 are considered as high. | 32 (low) |
| Glycemic load ⓘ Glycemic Load (GL) is a metric that measures both the quality (Glycemic Index) and quantity of carbohydrates in a specific serving of food to estimate its impact on blood sugar levels. It is calculated as: (GI × Carbs in grams) / 100. | 0 (low) |
| Net carbs ⓘ Net Carbs = Total Carbohydrates – Fiber – Sugar Alcohols | 2 g |
| Default serving size ⓘ Serving sizes are mostly taken from FDA's Reference Amounts Customarily Consumed (RACCs) | 1 medium (3/4" to 1" dia) (4.5 g) |
| Acidity (Based on PRAL) ⓘ PRAL (Potential renal acid load) is calculated using a formula. On the PRAL scale the higher the positive value, the more is the acidifying effect on the body. The lower the negative value, the higher the alkalinity of the food. 0 is neutral. | -4.4 (alkaline) |
| Oxalates | 0 mg ⓘ https://www.sciencedirect.com/science/article/abs/pii/S0889157513000902 |
Radish calories (kcal)
| Calories for different serving sizes of radish | Calories | Weight |
|---|---|---|
| Calories in 100 grams | 16 | |
| Calories in 1 slice | 0 | 1 g |
| Calories in 1 small | 0 | 2 g |
| Calories in 0.5 cup slices | 9 | 58 g |
| Calories in 1 cup slices | 19 | 116 g |
| Calories for different varieties of radish | Calories | Weight |
|---|---|---|
| Radishes, raw (this food) | 16 | 100 g |
| Radishes, white icicle, raw | 14 | 100 g |
Extra Nutrition facts for Radish
| Protein per 100 calories ⓘ Shows how many grams of protein you get from 100 calories of this food, calculated as (protein in g ÷ calories) × 100. | 4.3 g |
| Calories per 10 g protein ⓘ Shows how many calories you need to eat from this food to get 10 g of protein, calculated as (calories ÷ protein in g) × 10. | 235 kcal |
| Weight per 100 calories ⓘ Shows how many grams of this food equal 100 kcal—higher grams mean a larger portion for the same calories. | 625 g |
Radish Glycemic index (GI)
Mineral coverage chart
Mineral chart - relative view
Vitamin coverage chart
Vitamin chart - relative view
Protein quality breakdown
Fat type information
All nutrients for Radish per 100g
| Nutrient | Value | DV% | In TOP % of foods | Comparison |
| Vitamin A | 0µg | 0% | 100% | |
| Calories | 16kcal | 1% | 99% |
2.9 times less than Orange
|
| Protein | 0.68g | 2% | 89% |
4.1 times less than Broccoli
|
| Weight per 100 calories | 625g | N/A | 2% | |
| Protein per 100 calories | 4.3g | N/A | 50% | |
| Calories per 10 g protein | 235kcal | N/A | 47% | |
| Fats | 0.1g | 0% | 94% |
333.1 times less than Cheese
|
| Vitamin C | 15mg | 16% | 13% |
3.6 times less than Lemon
|
| Carbs | 3.4g | 1% | 65% |
8.3 times less than Rice
|
| Net carbs | 1.8g | N/A | 67% |
30.1 times less than Chocolate
|
| Cholesterol | 0mg | 0% | 100% |
N/A
|
| Vitamin D* | 0 IU | 0% | 100% |
N/A
|
| Vitamin D | 0µg | 0% | 100% |
N/A
|
| Magnesium | 10mg | 2% | 76% |
14 times less than Almonds
|
| Calcium | 25mg | 3% | 44% |
5 times less than Milk
|
| Potassium | 233mg | 7% | 47% |
1.6 times more than Cucumber
|
| Iron | 0.34mg | 4% | 82% |
7.6 times less than Beef broiled
|
| Sugar | 1.9g | N/A | 40% |
4.8 times less than Coca-Cola
|
| Fiber | 1.6g | 6% | 35% |
1.5 times less than Orange
|
| Copper | 0.05mg | 6% | 66% |
2.8 times less than Shiitake
|
| Zinc | 0.28mg | 3% | 73% |
22.5 times less than Beef broiled
|
| Starch | 0g | 0% | 100% |
N/A
|
| Phosphorus | 20mg | 3% | 82% |
9.1 times less than Chicken meat
|
| Sodium | 39mg | 2% | 75% |
12.6 times less than White bread
|
| Vitamin E | 0mg | 0% | 100% |
N/A
|
| Manganese | 0.07mg | 3% | 40% | |
| Selenium | 0.6µg | 1% | 69% | |
| Vitamin B1 | 0.01mg | 1% | 85% |
22.2 times less than Pea raw
|
| Vitamin B2 | 0.04mg | 3% | 78% |
3.3 times less than Avocado
|
| Vitamin B3 | 0.25mg | 2% | 79% |
37.7 times less than Turkey meat
|
| Vitamin B5 | 0.17mg | 3% | 59% |
6.8 times less than Sunflower seeds
|
| Vitamin B6 | 0.07mg | 5% | 62% |
1.7 times less than Oats
|
| Vitamin B12 | 0µg | 0% | 100% |
N/A
|
| Vitamin K | 1.3µg | 1% | 36% |
78.2 times less than Broccoli
|
| Trans fat | 0g | N/A | 100% |
N/A
|
| Folate | 25µg | 6% | 31% |
2.4 times less than Brussels sprouts
|
| Saturated fat | 0.03g | 0% | 85% |
184.2 times less than Beef broiled
|
| Choline | 6.5mg | 1% | 45% | |
| Monounsaturated fat | 0.02g | N/A | 83% |
576.4 times less than Avocado
|
| Polyunsaturated fat | 0.05g | N/A | 83% |
982.8 times less than Walnut
|
| Tryptophan | 0.01mg | 0% | 55% |
33.9 times less than Chicken meat
|
| Threonine | 0.02mg | 0% | 56% |
31.3 times less than Beef broiled
|
| Isoleucine | 0.02mg | 0% | 56% |
45.7 times less than Salmon raw
|
| Leucine | 0.03mg | 0% | 56% |
78.4 times less than Tuna Bluefin
|
| Lysine | 0.03mg | 0% | 56% |
13.7 times less than Tofu
|
| Methionine | 0.01mg | 0% | 55% |
9.6 times less than Quinoa
|
| Phenylalanine | 0.04mg | 0% | 54% |
18.6 times less than Egg
|
| Valine | 0.04mg | 0% | 55% |
58 times less than Soybean raw
|
| Histidine | 0.01mg | 0% | 56% |
57.6 times less than Turkey meat
|
| Fructose | 0.71g | 1% | 8% |
8.3 times less than Apple
|
| Caffeine | 0mg | 0% | 100% | |
| Omega-3 - EPA | 0g | N/A | 100% |
N/A
|
| Omega-3 - DHA | 0g | N/A | 100% |
N/A
|
| Omega-3 - DPA | 0g | N/A | 100% |
N/A
|
Check out similar food or compare with current
NUTRITION FACTS LABEL
Serving Size ______________
Health checks
Radish nutrition infographic
References
All the values for which the sources are not specified explicitly are taken from FDA’s Food Central. The exact link to the food presented on this page can be found below.