Rutabaga vs Radish — In-Depth Nutrition and Health Comparison


Summary
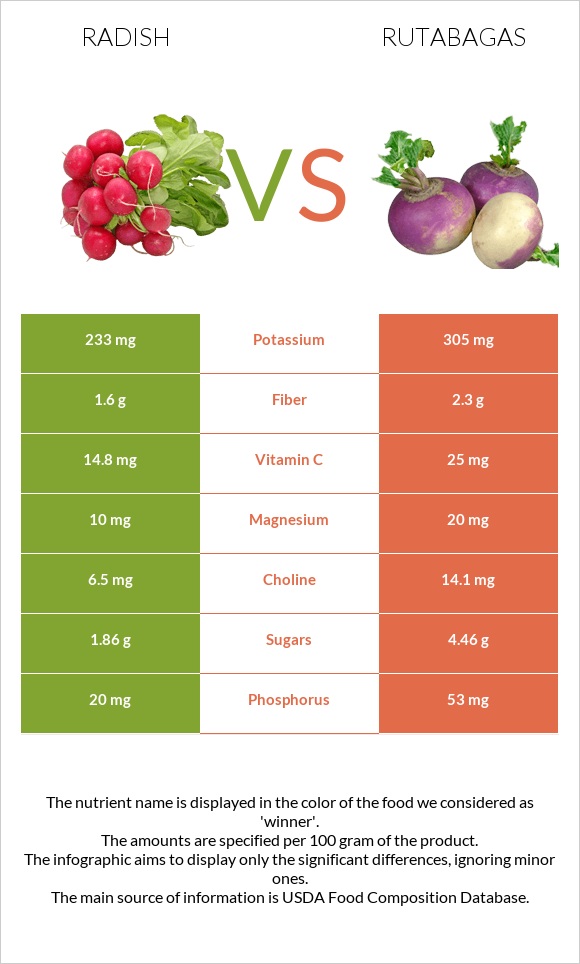
Rutabagas are richer than Radish in Vitamin C, Vitamin B3, Vitamin B1, Vitamin E, magnesium, phosphorus, and potassium. Radishes are higher in zinc and copper. Radishes are also low in sugar and have a lower GI.
Introduction
Radish and rutabagas are are root vegetables and are commonly used, but people often confuse these two vegetables. This article will identify their differences by focusing on their nutritional value and health impacts.
What's The Actual Difference?
Both radishes and rutabagas are root vegetables.
Rutabagas are yellow and grow in cooler climates. Besides, rutabagas are larger and more bitter than radishes. Radishes have a peppery and stingy flavor that can vary depending on how long they were left to grow in the ground.
Nutrition
In this section, we will look into the specific difference between the nutrients of rutabagas and radishes. At the bottom of this page, you can find nutrition infographics that visually show the differences in nutrition.
Carbs
Rutabagas and radishes contain a low amount of carbs. Radishes have 3.4g of carbs per 100g, whereas rutabagas contain 8.62g of carbs per 100g.
Radish contains 1.6g of fiber, and rutabagas contain 2.3g of fiber.
Fats
The fat content of rutabagas and radish is negligible.
Cholesterol
Both radish and rutabaga have no cholesterol.
Protein
The protein content of rutabagas and radish is negligible.
Vitamins
Rutabagas are richer in Vitamin C, Vitamin B1, Vitamin B1, Vitamin B3, Vitamin E, and Vitamin B6. The amount of Vitamin B1 is 6 times higher in rutabagas.
Vitamin Comparison
Contains
more
Vitamin KVitamin K
+333.3%
Contains
more
FolateFolate
+19%
Contains
more
Vitamin CVitamin C
+68.9%
Contains
more
Vitamin EVitamin E
+∞%
Contains
more
Vitamin B1Vitamin B1
+650%
Contains
more
Vitamin B3Vitamin B3
+175.6%
Contains
more
Vitamin B6Vitamin B6
+40.8%
Minerals
In general, rutabagas are relatively higher in minerals than radishes. Rutabagas have more iron, magnesium, phosphorus, calcium, and potassium and less sodium, whereas radishes contain more zinc and copper.
Mineral Comparison
Contains
more
CopperCopper
+56.3%
Contains
more
ZincZinc
+16.7%
Contains
more
MagnesiumMagnesium
+100%
Contains
more
CalciumCalcium
+72%
Contains
more
PotassiumPotassium
+30.9%
Contains
more
IronIron
+29.4%
Contains
more
PhosphorusPhosphorus
+165%
Contains
less
SodiumSodium
-69.2%
Contains
more
ManganeseManganese
+89.9%
Contains
more
SeleniumSelenium
+16.7%
Calories
Radish has 16 calories per 100 g, and rutabaga has 37 calories per 100 g. Both are considered low-calorie foods.
Health Impact
The nutritional values are presented for raw rutabagas and raw radishes.
Cardiovascular Health
When comparing rutabaga and radish in the context of cardiovascular risk, it's important to consider their nutritional profiles and how they might influence factors like blood pressure, cholesterol levels, and overall heart health.
Fiber: Both rutabaga and radish are good sources of dietary fiber, which is essential for lowering cholesterol levels, reducing blood pressure, and improving overall heart health. A diet high in fiber is linked to a lower risk of cardiovascular diseases (1).
Antioxidants: Both vegetables contain antioxidants, which help reduce oxidative stress and inflammation, key contributors to atherosclerosis, the main cause of coronary heart disease and myocardial infarction.
Blood Pressure Management: Radishes contain natural nitrates that can improve blood flow and reduce blood pressure. When combined with the high potassium content of rutabaga, these effects can be enhanced, providing a synergistic benefit for heart health (2, 3, 4).
Low Caloric Content: Both vegetables are low in calories, making them suitable for weight management, which is crucial for reducing cardiovascular risk.
To sum up, choosing between the two for cardiovascular health might depend on personal preference and specific nutritional needs. Including a variety of vegetables in your diet is generally the best approach to ensuring a broad range of nutrients and health benefits.
Diabetes
Radishes are low-calorie, low-GI, and high-fiber vegetables with chemical compounds, such as glucosinolate and isothiocyanate, and high-fiber vegetables that help regulate blood sugar levels. Consuming radishes boosts the body's natural production of adiponectin. Increased levels of this hormone may protect against insulin resistance. Radishes also have coenzyme Q10, an antioxidant that prevents diabetes (5).
Cancer
Radishes and other cruciferous vegetables can help prevent cancer. Radishes and rutabagas both contain phytochemicals and anthocyanins, which are anti-carcinogenic. They are high in sulforaphane, which studies have shown to be effective in the treatment of breast, colon, prostate, and ovarian cancers. The study (6) found that radish root extract contains several types of isothiocyanates, which cause cell death in some cancer cell lines.
Side Effects
Rutabagas and radishes are considered relatively safe vegetables, but they may not be suitable for people with gallstones. Goitrogenic foods can impair thyroid function by inhibiting thyroid hormone synthesis, resulting in gland enlargement.
Both of these foods are goitrogenic. Cooking and increasing selenium intake can reduce the risk of adverse effects in people with impaired thyroid function (7).
References
- https://pubmed.ncbi.nlm.nih.gov/26923351/
- https://www.nejm.org/doi/full/10.1056/NEJMc062800
- https://pubmed.ncbi.nlm.nih.gov/23558164/
- https://www.ncbi.nlm.nih.gov/pmc/articles/PMC3439574/
- https://pubmed.ncbi.nlm.nih.gov/28906451/
- https://pubmed.ncbi.nlm.nih.gov/27174619/
- https://link.springer.com/article/10.1007/s00394-012-0397-2

Infographic
All nutrients comparison - raw data values
| Nutrient | |
|
DV% diff. |
| Vitamin C | 14.8mg | 25mg | 11% |
| Vitamin B1 | 0.012mg | 0.09mg | 7% |
| Phosphorus | 20mg | 53mg | 5% |
| Fiber | 1.6g | 2.3g | 3% |
| Manganese | 0.069mg | 0.131mg | 3% |
| Vitamin B3 | 0.254mg | 0.7mg | 3% |
| Carbs | 3.4g | 8.62g | 2% |
| Magnesium | 10mg | 20mg | 2% |
| Calcium | 25mg | 43mg | 2% |
| Potassium | 233mg | 305mg | 2% |
| Copper | 0.05mg | 0.032mg | 2% |
| Vitamin E | 0mg | 0.3mg | 2% |
| Vitamin B6 | 0.071mg | 0.1mg | 2% |
| Calories | 16kcal | 37kcal | 1% |
| Protein | 0.68g | 1.08g | 1% |
| Iron | 0.34mg | 0.44mg | 1% |
| Sodium | 39mg | 12mg | 1% |
| Vitamin K | 1.3µg | 0.3µg | 1% |
| Folate | 25µg | 21µg | 1% |
| Choline | 6.5mg | 14.1mg | 1% |
| Fructose | 0.71g | 1.61g | 1% |
| Protein per 100 calories | 4.3g | 2.9g | N/A |
| Calories per 10 g protein | 235kcal | 343kcal | N/A |
| Weight per 100 calories | 625g | 270g | N/A |
| Fats | 0.1g | 0.16g | 0% |
| Net carbs | 1.8g | 6.32g | N/A |
| Sugar | 1.86g | 4.46g | N/A |
| Zinc | 0.28mg | 0.24mg | 0% |
| Starch | 0g | 0.4g | 0% |
| Selenium | 0.6µg | 0.7µg | 0% |
| Vitamin B2 | 0.039mg | 0.04mg | 0% |
| Vitamin B5 | 0.165mg | 0.16mg | 0% |
| Saturated fat | 0.032g | 0.027g | 0% |
| Monounsaturated fat | 0.017g | 0.025g | 0% |
| Polyunsaturated fat | 0.048g | 0.088g | 0% |
| Tryptophan | 0.009mg | 0% | |
| Threonine | 0.023mg | 0% | |
| Isoleucine | 0.02mg | 0% | |
| Leucine | 0.031mg | 0% | |
| Lysine | 0.033mg | 0% | |
| Methionine | 0.01mg | 0% | |
| Phenylalanine | 0.036mg | 0% | |
| Valine | 0.035mg | 0% | |
| Histidine | 0.013mg | 0% |
Macronutrient Comparison
| Contains more ProteinProtein | +58.8% |
| Contains more FatsFats | +60% |
| Contains more CarbsCarbs | +153.5% |
| Contains more OtherOther | +29.1% |
Fat Type Comparison
| Contains less Sat. FatSaturated fat | -15.6% |
| Contains more Mono. FatMonounsaturated fat | +47.1% |
| Contains more Poly. FatPolyunsaturated fat | +83.3% |
Carbohydrate type comparison
| Contains more StarchStarch | +∞% |
| Contains more SucroseSucrose | +430% |
| Contains more GlucoseGlucose | +119% |
| Contains more FructoseFructose | +126.8% |
| Contains more MaltoseMaltose | +∞% |
People also compare


References
All the values for which the sources are not specified explicitly are taken from FDA’s Food Central. The exact link to the food presented on this page can be found below.
- Radish - https://fdc.nal.usda.gov/fdc-app.html#/food-details/169276/nutrients
- Rutabagas - https://fdc.nal.usda.gov/fdc-app.html#/food-details/168454/nutrients
All the Daily Values are presented for males aged 31-50, for 2000-calorie diets.