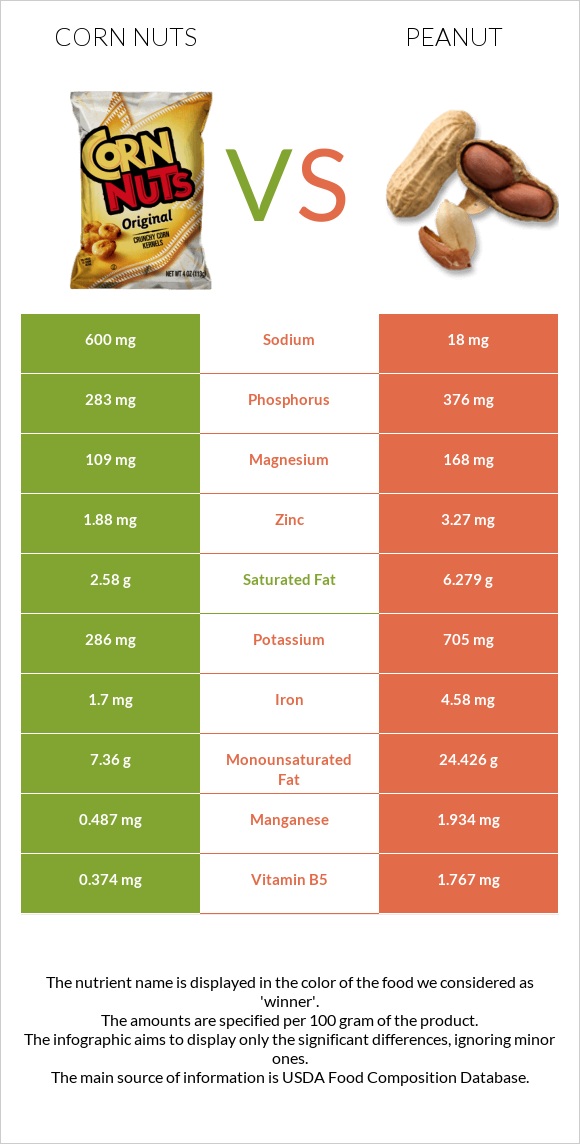
How are corn nuts and peanuts different? Peanuts are higher than corn nuts in copper, vitamin B3, manganese, folate, iron, vitamin B5, vitamin B1, and magnesium. Peanuts cover your daily need for copper, 112% more than corn nuts. Corn nuts contain 33 times more sodium than peanuts. Corn nuts contain 600mg of sodium, while peanuts contain 18mg. Corn nuts have a higher glycemic index (40) than peanuts (13). Snacks, cornnuts, barbecue-flavor and Peanuts, all types, raw types were used in this article.
Infographic
Mineral Comparison
Mineral comparison score is based on the number of minerals by which one or the other food is richer. The "coverage" charts below show how much of the daily needs can be covered by 300 grams of the food.
0
100 g
300 g
1 oz - 28.35g 2 oz - 57g
Magnesium
Magnesium
Calcium
Calcium
Potassium
Potassium
Iron
Iron
Copper
Copper
Zinc
Zinc
Phosphorus
Phosphorus
Sodium
Sodium
Manganese
Manganese
Selenium
Selenium
78%
5.1%
25%
64%
45%
51%
121%
78%
64%
0%
10
100 g
300 g
1 oz - 28.35g 1 cup - 146g
Magnesium
Magnesium
Calcium
Calcium
Potassium
Potassium
Iron
Iron
Copper
Copper
Zinc
Zinc
Phosphorus
Phosphorus
Sodium
Sodium
Manganese
Manganese
Selenium
Selenium
120%
28%
62%
172%
381%
89%
161%
2.3%
252%
39%
Vitamin Comparison
Vitamin comparison score is based on the number of vitamins by which one or the other food is richer. The "coverage" charts below show how much of the daily needs can be covered by 300 grams of the food.
2
100 g
300 g
1 oz - 28.35g 2 oz - 57g
Vitamin C
Vit. C
Vitamin D
Vit. D
Vitamin A
Vit. A
Vitamin E
Vit. E
Vitamin B1
Vit. B1
Vitamin B2
Vit. B2
Vitamin B3
Vit. B3
Vitamin B5
Vit. B5
Vitamin B6
Vit. B6
Vitamin B12
Vit. B12
Vitamin K
Vit. K
Folate
Folate
1.3%
0%
5.7%
0%
88%
33%
28%
22%
43%
0%
0%
0%
6
100 g
300 g
1 oz - 28.35g 1 cup - 146g
Vitamin C
Vit. C
Vitamin D
Vit. D
Vitamin A
Vit. A
Vitamin E
Vit. E
Vitamin B1
Vit. B1
Vitamin B2
Vit. B2
Vitamin B3
Vit. B3
Vitamin B5
Vit. B5
Vitamin B6
Vit. B6
Vitamin B12
Vit. B12
Vitamin K
Vit. K
Folate
Folate
0%
0%
0%
167%
160%
31%
226%
106%
80%
0%
0%
180%
All nutrients comparison - raw data values
Nutrient
DV% diff.
Copper
0.136mg
1.144mg
112%
Polyunsaturated fat
3.22g
15.558g
82%
Vitamin B3
1.507mg
12.066mg
66%
Manganese
0.487mg
1.934mg
63%
Folate
0µg
240µg
60%
Vitamin E
8.33mg
56%
Fats
14.3g
49.24g
54%
Monounsaturated fat
7.36g
24.426g
43%
Iron
1.7mg
4.58mg
36%
Protein
9g
25.8g
34%
Vitamin B5
0.374mg
1.767mg
28%
Sodium
600mg
18mg
25%
Vitamin B1
0.35mg
0.64mg
24%
Carbs
71.7g
16.13g
19%
Saturated fat
2.58g
6.279g
17%
Magnesium
109mg
168mg
14%
Zinc
1.88mg
3.27mg
13%
Phosphorus
283mg
376mg
13%
Selenium
7.2µg
13%
Potassium
286mg
705mg
12%
Vitamin B6
0.187mg
0.348mg
12%
Choline
52.5mg
10%
Calcium
17mg
92mg
8%
Calories
436kcal
567kcal
7%
Vitamin A
17µg
0µg
2%
Vitamin B2
0.142mg
0.135mg
1%
Protein per 100 calories
2.1g
4.6g
N/A
Calories per 10 g protein
484kcal
220kcal
N/A
Weight per 100 calories
23g
18g
N/A
Unsaturated / Saturated Fat ratio
4.1
6.4
N/A
Vitamin C
0.4mg
0mg
0%
Net carbs
63.3g
7.63g
N/A
Sugar
4.72g
N/A
Fiber
8.4g
8.5g
0%
Tryptophan
0.25mg
0%
Threonine
0.883mg
0%
Isoleucine
0.907mg
0%
Leucine
1.672mg
0%
Lysine
0.926mg
0%
Methionine
0.317mg
0%
Phenylalanine
1.377mg
0%
Valine
1.082mg
0%
Histidine
0.652mg
0%
Macronutrient Comparison
Macronutrient breakdown side-by-side comparison
2
9%
14%
72%
3%
Protein:
9 g
Fats:
14.3 g
Carbs:
71.7 g
Water:
1.6 g
Other:
3.4 g
3
26%
49%
16%
7%
2%
Protein:
25.8 g
Fats:
49.24 g
Carbs:
16.13 g
Water:
6.5 g
Other:
2.33 g
Contains
more
Carbs Carbs
+344.5%
Contains
more
Other Other
+45.9%
Contains
more
Protein Protein
+186.7%
Contains
more
Fats Fats
+244.3%
Contains
more
Water Water
+306.3%
Fat Type Comparison
Fat type breakdown side-by-side comparison
1
20%
56%
24%
Saturated fat:
Sat. Fat
2.58 g
Monounsaturated fat:
Mono. Fat
7.36 g
Polyunsaturated fat:
Poly. Fat
3.22 g
2
14%
53%
34%
Saturated fat:
Sat. Fat
6.279 g
Monounsaturated fat:
Mono. Fat
24.426 g
Polyunsaturated fat:
Poly. Fat
15.558 g
Contains
less
Sat. Fat Saturated fat
-58.9%
Contains
more
Mono. Fat Monounsaturated fat
+231.9%
Contains
more
Poly. Fat Polyunsaturated fat
+383.2%