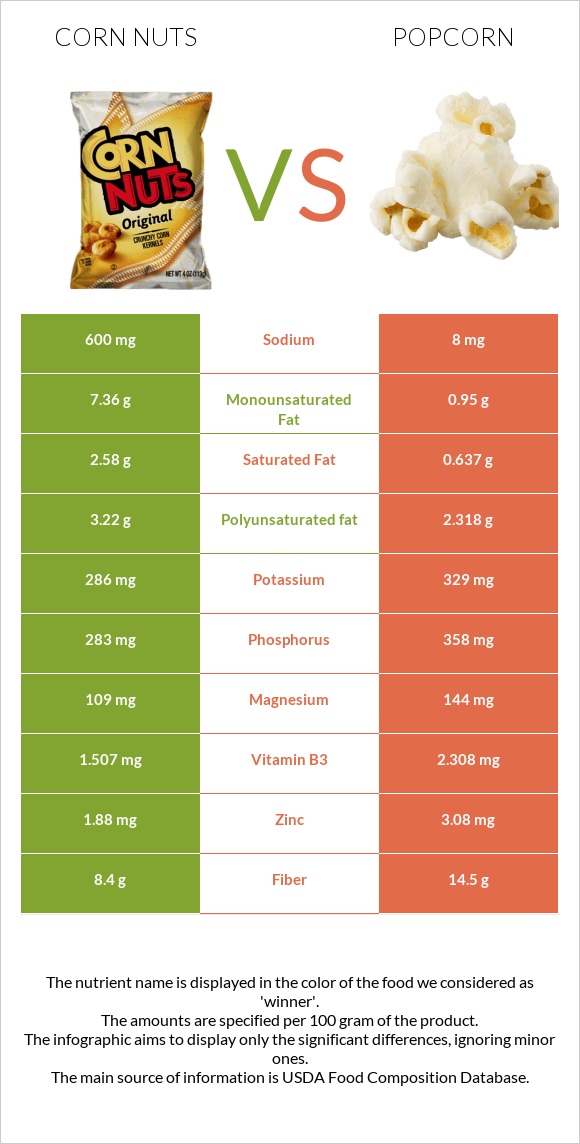
A recap on the differences between corn nuts and popcorn Corn nuts have more vitamin B1; however, popcorn is higher in manganese, fiber, iron, copper, zinc, phosphorus, and magnesium. Popcorn covers your daily manganese needs 27% more than corn nuts. Popcorn contains 75 times less sodium than corn nuts. Corn nuts contain 600mg of sodium, while popcorn contains 8mg. The glycemic index of popcorn is higher. Food varieties used in this article are Snacks, cornnuts, barbecue-flavor and Snacks, popcorn, air-popped .
Infographic
Mineral Comparison
Mineral comparison score is based on the number of minerals by which one or the other food is richer. The "coverage" charts below show how much of the daily needs can be covered by 300 grams of the food.
1
100 g
300 g
1 oz - 28.35g 2 oz - 57g
Magnesium
Magnesium
Calcium
Calcium
Potassium
Potassium
Iron
Iron
Copper
Copper
Zinc
Zinc
Phosphorus
Phosphorus
Sodium
Sodium
Manganese
Manganese
Selenium
Selenium
78%
5.1%
25%
64%
45%
51%
121%
78%
64%
0%
8
100 g
300 g
1 cup - 8g 1 oz - 28.35g
Magnesium
Magnesium
Calcium
Calcium
Potassium
Potassium
Iron
Iron
Copper
Copper
Zinc
Zinc
Phosphorus
Phosphorus
Sodium
Sodium
Manganese
Manganese
Selenium
Selenium
103%
2.1%
29%
120%
87%
84%
153%
1%
145%
0%
Vitamin Comparison
Vitamin comparison score is based on the number of vitamins by which one or the other food is richer. The "coverage" charts below show how much of the daily needs can be covered by 300 grams of the food.
5
100 g
300 g
1 oz - 28.35g 2 oz - 57g
Vitamin C
Vit. C
Vitamin D
Vit. D
Vitamin A
Vit. A
Vitamin E
Vit. E
Vitamin B1
Vit. B1
Vitamin B2
Vit. B2
Vitamin B3
Vit. B3
Vitamin B5
Vit. B5
Vitamin B6
Vit. B6
Vitamin B12
Vit. B12
Vitamin K
Vit. K
Folate
Folate
1.3%
0%
5.7%
0%
88%
33%
28%
22%
43%
0%
0%
0%
5
100 g
300 g
1 cup - 8g 1 oz - 28.35g
Vitamin C
Vit. C
Vitamin D
Vit. D
Vitamin A
Vit. A
Vitamin E
Vit. E
Vitamin B1
Vit. B1
Vitamin B2
Vit. B2
Vitamin B3
Vit. B3
Vitamin B5
Vit. B5
Vitamin B6
Vit. B6
Vitamin B12
Vit. B12
Vitamin K
Vit. K
Folate
Folate
0%
0%
3.3%
5.8%
26%
19%
43%
31%
36%
0%
3%
23%
All nutrients comparison - raw data values
Nutrient
DV% diff.
Manganese
0.487mg
1.113mg
27%
Sodium
600mg
8mg
26%
Fiber
8.4g
14.5g
24%
Starch
54.4g
22%
Vitamin B1
0.35mg
0.104mg
21%
Iron
1.7mg
3.19mg
19%
Monounsaturated fat
7.36g
0.95g
16%
Fats
14.3g
4.54g
15%
Copper
0.136mg
0.262mg
14%
Zinc
1.88mg
3.08mg
11%
Phosphorus
283mg
358mg
11%
Saturated fat
2.58g
0.637g
9%
Protein
9g
12.94g
8%
Magnesium
109mg
144mg
8%
Folate
0µg
31µg
8%
Polyunsaturated fat
3.22g
2.318g
6%
Vitamin B2
0.142mg
0.083mg
5%
Vitamin B3
1.507mg
2.308mg
5%
Choline
21.2mg
4%
Vitamin B5
0.374mg
0.51mg
3%
Calories
436kcal
387kcal
2%
Carbs
71.7g
77.78g
2%
Vitamin E
0.29mg
2%
Vitamin B6
0.187mg
0.157mg
2%
Calcium
17mg
7mg
1%
Potassium
286mg
329mg
1%
Vitamin A
17µg
10µg
1%
Vitamin K
1.2µg
1%
Protein per 100 calories
2.1g
3.3g
N/A
Calories per 10 g protein
484kcal
299kcal
N/A
Weight per 100 calories
23g
26g
N/A
Unsaturated / Saturated Fat ratio
4.1
5.1
N/A
Vitamin C
0.4mg
0mg
0%
Net carbs
63.3g
63.28g
N/A
Sugar
0.87g
N/A
Tryptophan
0.085mg
0%
Threonine
0.452mg
0%
Isoleucine
0.431mg
0%
Leucine
1.473mg
0%
Lysine
0.338mg
0%
Methionine
0.252mg
0%
Phenylalanine
0.59mg
0%
Valine
0.607mg
0%
Histidine
0.367mg
0%
Fructose
0.07g
0%
Macronutrient Comparison
Macronutrient breakdown side-by-side comparison
2
9%
14%
72%
3%
Protein:
9 g
Fats:
14.3 g
Carbs:
71.7 g
Water:
1.6 g
Other:
3.4 g
3
13%
5%
78%
3%
Protein:
12.94 g
Fats:
4.54 g
Carbs:
77.78 g
Water:
3.32 g
Other:
1.42 g
Contains
more
Fats Fats
+215%
Contains
more
Other Other
+139.4%
Contains
more
Protein Protein
+43.8%
Contains
more
Water Water
+107.5%
Fat Type Comparison
Fat type breakdown side-by-side comparison
2
20%
56%
24%
Saturated fat:
Sat. Fat
2.58 g
Monounsaturated fat:
Mono. Fat
7.36 g
Polyunsaturated fat:
Poly. Fat
3.22 g
1
16%
24%
59%
Saturated fat:
Sat. Fat
0.637 g
Monounsaturated fat:
Mono. Fat
0.95 g
Polyunsaturated fat:
Poly. Fat
2.318 g
Contains
more
Mono. Fat Monounsaturated fat
+674.7%
Contains
more
Poly. Fat Polyunsaturated fat
+38.9%
Contains
less
Sat. Fat Saturated fat
-75.3%