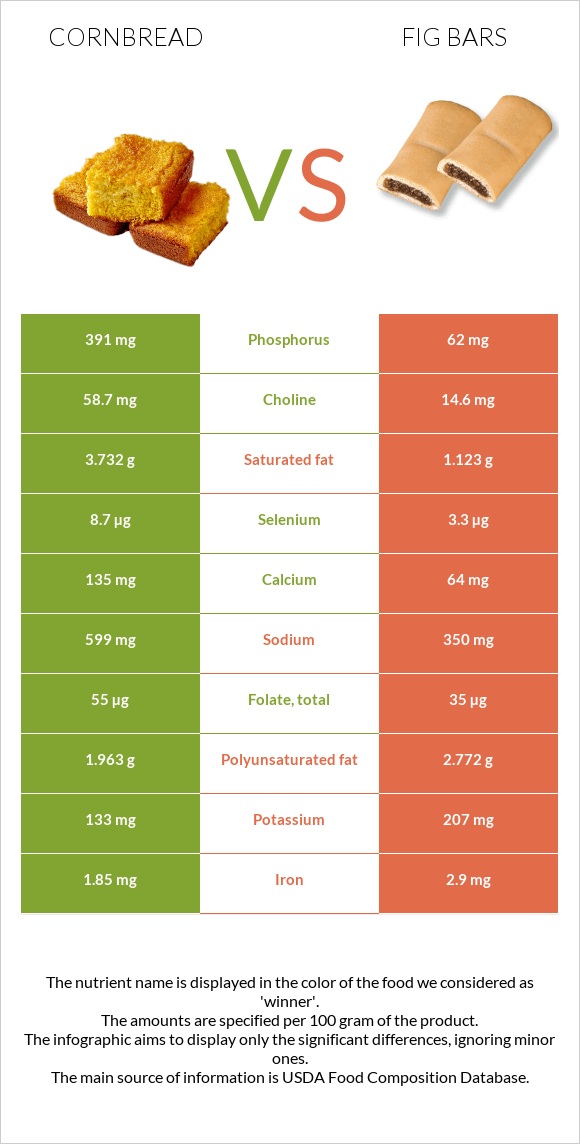
Summary of differences between cornbread and fig bars Cornbread has more phosphorus, selenium, choline, and calcium, while fig bars have more iron, fiber, and copper. Cornbread covers your daily need for phosphorus, 47% more than fig bars. These are the specific foods used in this comparison Bread, cornbread, dry mix, prepared with 2% milk, 80% margarine, and eggs and Cookies, fig bars .
Infographic
Mineral Comparison
Mineral comparison score is based on the number of minerals by which one or the other food is richer. The "coverage" charts below show how much of the daily needs can be covered by 300 grams of the food.
4
100 g
300 g
1 oz - 28.35g 1 muffin - 51g 1 piece - 60g
Magnesium
Magnesium
Calcium
Calcium
Potassium
Potassium
Iron
Iron
Copper
Copper
Zinc
Zinc
Phosphorus
Phosphorus
Sodium
Sodium
Manganese
Manganese
Selenium
Selenium
12%
41%
12%
69%
24%
18%
168%
78%
29%
47%
6
100 g
300 g
1 cookie - 16g 1 oz - 28.35g 1 Figaroo (2 square halves) - 43g 1 individual package (2 oz package containing 2 3" bars) - 57g
Magnesium
Magnesium
Calcium
Calcium
Potassium
Potassium
Iron
Iron
Copper
Copper
Zinc
Zinc
Phosphorus
Phosphorus
Sodium
Sodium
Manganese
Manganese
Selenium
Selenium
19%
19%
18%
109%
49%
11%
27%
46%
45%
18%
Vitamin Comparison
Vitamin comparison score is based on the number of vitamins by which one or the other food is richer. The "coverage" charts below show how much of the daily needs can be covered by 300 grams of the food.
6
100 g
300 g
1 oz - 28.35g 1 muffin - 51g 1 piece - 60g
Vitamin C
Vit. C
Vitamin D
Vit. D
Vitamin A
Vit. A
Vitamin E
Vit. E
Vitamin B1
Vit. B1
Vitamin B2
Vit. B2
Vitamin B3
Vit. B3
Vitamin B5
Vit. B5
Vitamin B6
Vit. B6
Vitamin B12
Vit. B12
Vitamin K
Vit. K
Folate
Folate
0.33%
0%
12%
10%
48%
40%
38%
35%
20%
29%
9.3%
41%
4
100 g
300 g
1 cookie - 16g 1 oz - 28.35g 1 Figaroo (2 square halves) - 43g 1 individual package (2 oz package containing 2 3" bars) - 57g
Vitamin C
Vit. C
Vitamin D
Vit. D
Vitamin A
Vit. A
Vitamin E
Vit. E
Vitamin B1
Vit. B1
Vitamin B2
Vit. B2
Vitamin B3
Vit. B3
Vitamin B5
Vit. B5
Vitamin B6
Vit. B6
Vitamin B12
Vit. B12
Vitamin K
Vit. K
Folate
Folate
1%
0%
3%
13%
40%
50%
35%
22%
17%
11%
15%
26%
All nutrients comparison - raw data values
Nutrient
DV% diff.
Phosphorus
391mg
62mg
47%
Cholesterol
57mg
0mg
19%
Starch
35.66g
15%
Iron
1.85mg
2.9mg
13%
Saturated fat
3.732g
1.123g
12%
Sodium
599mg
350mg
11%
Selenium
8.7µg
3.3µg
10%
Fiber
2.3g
4.6g
9%
Copper
0.073mg
0.147mg
8%
Choline
58.7mg
14.6mg
8%
Calcium
135mg
64mg
7%
Protein
6.59g
3.7g
6%
Vitamin B12
0.23µg
0.09µg
6%
Carbs
54.46g
70.9g
5%
Manganese
0.222mg
0.343mg
5%
Folate
55µg
35µg
5%
Polyunsaturated fat
1.963g
2.772g
5%
Fats
9.58g
7.3g
4%
Vitamin B5
0.579mg
0.364mg
4%
Zinc
0.67mg
0.39mg
3%
Vitamin A
35µg
9µg
3%
Vitamin B1
0.19mg
0.158mg
3%
Vitamin B2
0.175mg
0.217mg
3%
Magnesium
17mg
27mg
2%
Potassium
133mg
207mg
2%
Vitamin K
3.7µg
5.8µg
2%
Calories
330kcal
348kcal
1%
Vitamin E
0.51mg
0.65mg
1%
Vitamin B3
2.004mg
1.874mg
1%
Vitamin B6
0.085mg
0.075mg
1%
Monounsaturated fat
3.494g
3.003g
1%
Protein per 100 calories
2g
1.1g
N/A
Calories per 10 g protein
501kcal
941kcal
N/A
Weight per 100 calories
30g
29g
N/A
Unsaturated / Saturated Fat ratio
1.5
5.1
N/A
Vitamin C
0.1mg
0.3mg
0%
Net carbs
52.16g
66.3g
N/A
Sugar
16.05g
46.36g
N/A
Trans fat
0.224g
N/A
Tryptophan
0.059mg
0.046mg
0%
Threonine
0.226mg
0.113mg
0%
Isoleucine
0.265mg
0.132mg
0%
Leucine
0.658mg
0.224mg
0%
Lysine
0.324mg
0.14mg
0%
Methionine
0.157mg
0.053mg
0%
Phenylalanine
0.343mg
0.145mg
0%
Valine
0.334mg
0.155mg
0%
Histidine
0.167mg
0.067mg
0%
Fructose
0.2g
0%
Omega-3 - DHA
0.007g
0g
N/A
Omega-3 - ALA
0.076g
N/A
Omega-3 - DPA
0.003g
0g
N/A
Omega-3 - Eicosatrienoic acid
0.004g
N/A
Omega-6 - Gamma-linoleic acid
0.004g
N/A
Omega-6 - Dihomo-gamma-linoleic acid
0.009g
N/A
Omega-6 - Eicosadienoic acid
0.043g
N/A
Omega-6 - Linoleic acid
1.726g
N/A
Macronutrient Comparison
Macronutrient breakdown side-by-side comparison
4
7%
10%
54%
27%
2%
Protein:
6.59 g
Fats:
9.58 g
Carbs:
54.46 g
Water:
27.11 g
Other:
2.26 g
1
4%
7%
71%
17%
Protein:
3.7 g
Fats:
7.3 g
Carbs:
70.9 g
Water:
16.5 g
Other:
1.6 g
Contains
more
Protein Protein
+78.1%
Contains
more
Fats Fats
+31.2%
Contains
more
Water Water
+64.3%
Contains
more
Other Other
+41.3%
Contains
more
Carbs Carbs
+30.2%
Fat Type Comparison
Fat type breakdown side-by-side comparison
1
41%
38%
21%
Saturated fat:
Sat. Fat
3.732 g
Monounsaturated fat:
Mono. Fat
3.494 g
Polyunsaturated fat:
Poly. Fat
1.963 g
2
16%
44%
40%
Saturated fat:
Sat. Fat
1.123 g
Monounsaturated fat:
Mono. Fat
3.003 g
Polyunsaturated fat:
Poly. Fat
2.772 g
Contains
more
Mono. Fat Monounsaturated fat
+16.4%
Contains
less
Sat. Fat Saturated fat
-69.9%
Contains
more
Poly. Fat Polyunsaturated fat
+41.2%