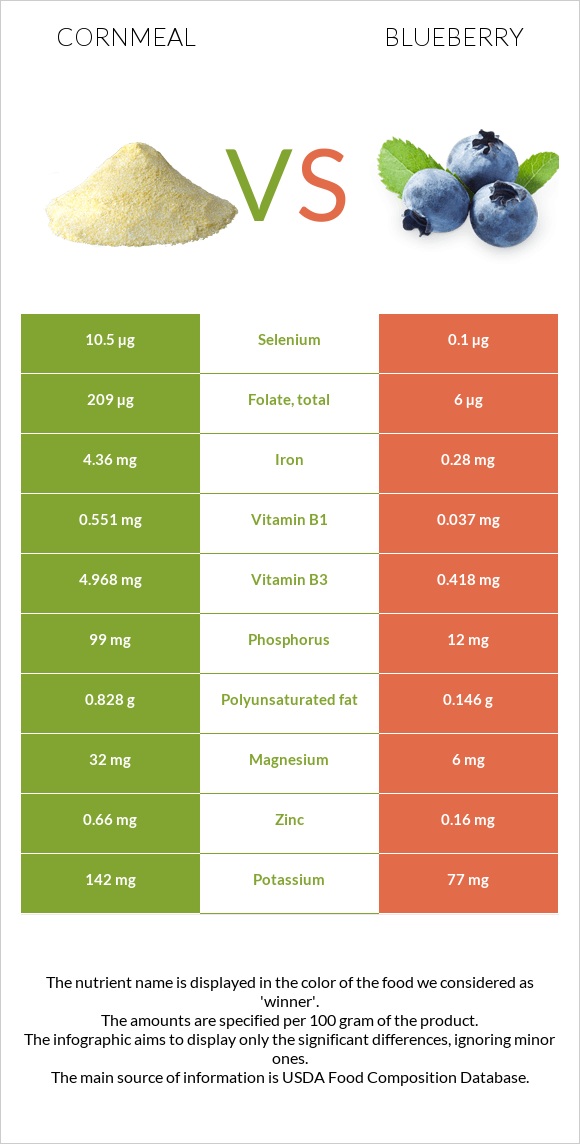
Important differences between cornmeal and blueberries Cornmeal has more iron, folate, vitamin B1, vitamin B3, vitamin B2, selenium, phosphorus, and vitamin B6; however, blueberries are richer in vitamin K and vitamin C. Cornmeal's daily need coverage for iron is 51% more. Cornmeal contains 105 times more selenium than blueberries. Cornmeal contains 10.5µg of selenium, while blueberries contain 0.1µg. Cornmeal has a higher glycemic index. The glycemic index of cornmeal is 68, while the glycemic index of blueberries is 53. The food varieties used in the comparison are Cornmeal, degermed, enriched, yellow and Blueberries, raw .
Infographic
Mineral Comparison
Mineral comparison score is based on the number of minerals by which one or the other food is richer. The "coverage" charts below show how much of the daily needs can be covered by 300 grams of the food.
7
100 g
300 g
1 cup - 157g
Magnesium
Magnesium
Calcium
Calcium
Potassium
Potassium
Iron
Iron
Copper
Copper
Zinc
Zinc
Phosphorus
Phosphorus
Sodium
Sodium
Manganese
Manganese
Selenium
Selenium
23%
0.9%
13%
164%
25%
18%
42%
0.91%
23%
57%
3
100 g
300 g
50 berries - 68g 1 cup - 148g
Magnesium
Magnesium
Calcium
Calcium
Potassium
Potassium
Iron
Iron
Copper
Copper
Zinc
Zinc
Phosphorus
Phosphorus
Sodium
Sodium
Manganese
Manganese
Selenium
Selenium
4.3%
1.8%
6.8%
11%
19%
4.4%
5.1%
0.13%
44%
0.55%
Vitamin Comparison
Vitamin comparison score is based on the number of vitamins by which one or the other food is richer. The "coverage" charts below show how much of the daily needs can be covered by 300 grams of the food.
7
100 g
300 g
1 cup - 157g
Vitamin C
Vit. C
Vitamin D
Vit. D
Vitamin A
Vit. A
Vitamin E
Vit. E
Vitamin B1
Vit. B1
Vitamin B2
Vit. B2
Vitamin B3
Vit. B3
Vitamin B5
Vit. B5
Vitamin B6
Vit. B6
Vitamin B12
Vit. B12
Vitamin K
Vit. K
Folate
Folate
0%
0%
3.7%
2.4%
138%
88%
93%
14%
42%
0%
0%
157%
3
100 g
300 g
50 berries - 68g 1 cup - 148g
Vitamin C
Vit. C
Vitamin D
Vit. D
Vitamin A
Vit. A
Vitamin E
Vit. E
Vitamin B1
Vit. B1
Vitamin B2
Vit. B2
Vitamin B3
Vit. B3
Vitamin B5
Vit. B5
Vitamin B6
Vit. B6
Vitamin B12
Vit. B12
Vitamin K
Vit. K
Folate
Folate
32%
0%
1%
11%
9.3%
9.5%
7.8%
7.4%
12%
0%
48%
4.5%
All nutrients comparison - raw data values
Nutrient
DV% diff.
Iron
4.36mg
0.28mg
51%
Folate
209µg
6µg
51%
Vitamin B1
0.551mg
0.037mg
43%
Starch
73.3g
0.03g
30%
Vitamin B3
4.968mg
0.418mg
28%
Vitamin B2
0.382mg
0.041mg
26%
Carbs
79.45g
14.49g
22%
Selenium
10.5µg
0.1µg
19%
Calories
370kcal
57kcal
16%
Vitamin K
0µg
19.3µg
16%
Protein
7.11g
0.74g
13%
Phosphorus
99mg
12mg
12%
Vitamin C
0mg
9.7mg
11%
Vitamin B6
0.182mg
0.052mg
10%
Manganese
0.174mg
0.336mg
7%
Magnesium
32mg
6mg
6%
Fiber
3.9g
2.4g
6%
Fructose
0.17g
4.97g
6%
Zinc
0.66mg
0.16mg
5%
Polyunsaturated fat
0.828g
0.146g
5%
Vitamin E
0.12mg
0.57mg
3%
Fats
1.75g
0.33g
2%
Potassium
142mg
77mg
2%
Copper
0.076mg
0.057mg
2%
Vitamin B5
0.24mg
0.124mg
2%
Vitamin A
11µg
3µg
1%
Saturated fat
0.22g
0.028g
1%
Monounsaturated fat
0.39g
0.047g
1%
Protein per 100 calories
1.9g
1.3g
N/A
Calories per 10 g protein
520kcal
770kcal
N/A
Weight per 100 calories
27g
175g
N/A
Net carbs
75.55g
12.09g
N/A
Calcium
3mg
6mg
0%
Sugar
1.61g
9.96g
N/A
Sodium
7mg
1mg
0%
Choline
8.6mg
6mg
0%
Tryptophan
0.038mg
0.003mg
0%
Threonine
0.172mg
0.02mg
0%
Isoleucine
0.242mg
0.023mg
0%
Leucine
1.006mg
0.044mg
0%
Lysine
0.105mg
0.013mg
0%
Methionine
0.162mg
0.012mg
0%
Phenylalanine
0.366mg
0.026mg
0%
Valine
0.337mg
0.031mg
0%
Histidine
0.172mg
0.011mg
0%
Macronutrient Comparison
Macronutrient breakdown side-by-side comparison
4
7%
2%
79%
11%
Protein:
7.11 g
Fats:
1.75 g
Carbs:
79.45 g
Water:
11.18 g
Other:
0.51 g
1
14%
84%
Protein:
0.74 g
Fats:
0.33 g
Carbs:
14.49 g
Water:
84.21 g
Other:
0.23 g
Contains
more
Protein Protein
+860.8%
Contains
more
Fats Fats
+430.3%
Contains
more
Carbs Carbs
+448.3%
Contains
more
Other Other
+121.7%
Contains
more
Water Water
+653.2%
Fat Type Comparison
Fat type breakdown side-by-side comparison
2
15%
27%
58%
Saturated fat:
Sat. Fat
0.22 g
Monounsaturated fat:
Mono. Fat
0.39 g
Polyunsaturated fat:
Poly. Fat
0.828 g
1
13%
21%
66%
Saturated fat:
Sat. Fat
0.028 g
Monounsaturated fat:
Mono. Fat
0.047 g
Polyunsaturated fat:
Poly. Fat
0.146 g
Contains
more
Mono. Fat Monounsaturated fat
+729.8%
Contains
more
Poly. Fat Polyunsaturated fat
+467.1%
Contains
less
Sat. Fat Saturated fat
-87.3%
Carbohydrate type comparison
Carbohydrate type breakdown side-by-side comparison
3
98%
Starch:
73.3 g
Sucrose:
0.68 g
Glucose:
0.56 g
Fructose:
0.17 g
Lactose:
0 g
Maltose:
0.19 g
Galactose:
0 g
2
49%
50%
Starch:
0.03 g
Sucrose:
0.11 g
Glucose:
4.88 g
Fructose:
4.97 g
Lactose:
0 g
Maltose:
0 g
Galactose:
0 g
Contains
more
Starch Starch
+244233.3%
Contains
more
Sucrose Sucrose
+518.2%
Contains
more
Maltose Maltose
+∞%
Contains
more
Glucose Glucose
+771.4%
Contains
more
Fructose Fructose
+2823.5%
~equal in
Lactose
~0g
~equal in
Galactose
~0g