Important differences between cornmeal and papadum Cornmeal has more vitamin B1; however, papadum is richer in copper, manganese, fiber, magnesium, iron, phosphorus, potassium, and zinc. Papadum's daily need coverage for copper is 102% more. Cornmeal contains 2 times more vitamin B1 than papadum. Cornmeal contains 0.551mg of vitamin B1, while papadum contains 0.277mg. Cornmeal contains less sodium. Cornmeal has a higher glycemic index. The glycemic index of cornmeal is 68, while the glycemic index of papadum is 46. The food varieties used in the comparison are Cornmeal, degermed, enriched, yellow and Papad .
Infographic
Mineral Comparison
Mineral comparison score is based on the number of minerals by which one or the other food is richer. The "coverage" charts below show how much of the daily needs can be covered by 300 grams of the food.
2
100 g
300 g
1 cup - 157g
Magnesium
Magnesium
Calcium
Calcium
Potassium
Potassium
Iron
Iron
Copper
Copper
Zinc
Zinc
Phosphorus
Phosphorus
Sodium
Sodium
Manganese
Manganese
Selenium
Selenium
23%
0.9%
13%
164%
25%
18%
42%
0.91%
23%
57%
8
100 g
300 g
Magnesium
Magnesium
Calcium
Calcium
Potassium
Potassium
Iron
Iron
Copper
Copper
Zinc
Zinc
Phosphorus
Phosphorus
Sodium
Sodium
Manganese
Manganese
Selenium
Selenium
194%
43%
88%
293%
333%
93%
165%
228%
204%
45%
Vitamin Comparison
Vitamin comparison score is based on the number of vitamins by which one or the other food is richer. The "coverage" charts below show how much of the daily needs can be covered by 300 grams of the food.
4
100 g
300 g
1 cup - 157g
Vitamin C
Vit. C
Vitamin D
Vit. D
Vitamin A
Vit. A
Vitamin E
Vit. E
Vitamin B1
Vit. B1
Vitamin B2
Vit. B2
Vitamin B3
Vit. B3
Vitamin B5
Vit. B5
Vitamin B6
Vit. B6
Vitamin B12
Vit. B12
Vitamin K
Vit. K
Folate
Folate
0%
0%
3.7%
2.4%
138%
88%
93%
14%
42%
0%
0%
157%
4
100 g
300 g
Vitamin C
Vit. C
Vitamin D
Vit. D
Vitamin A
Vit. A
Vitamin E
Vit. E
Vitamin B1
Vit. B1
Vitamin B2
Vit. B2
Vitamin B3
Vit. B3
Vitamin B5
Vit. B5
Vitamin B6
Vit. B6
Vitamin B12
Vit. B12
Vitamin K
Vit. K
Folate
Folate
0%
0%
4.3%
1%
69%
60%
28%
55%
66%
0%
1%
164%
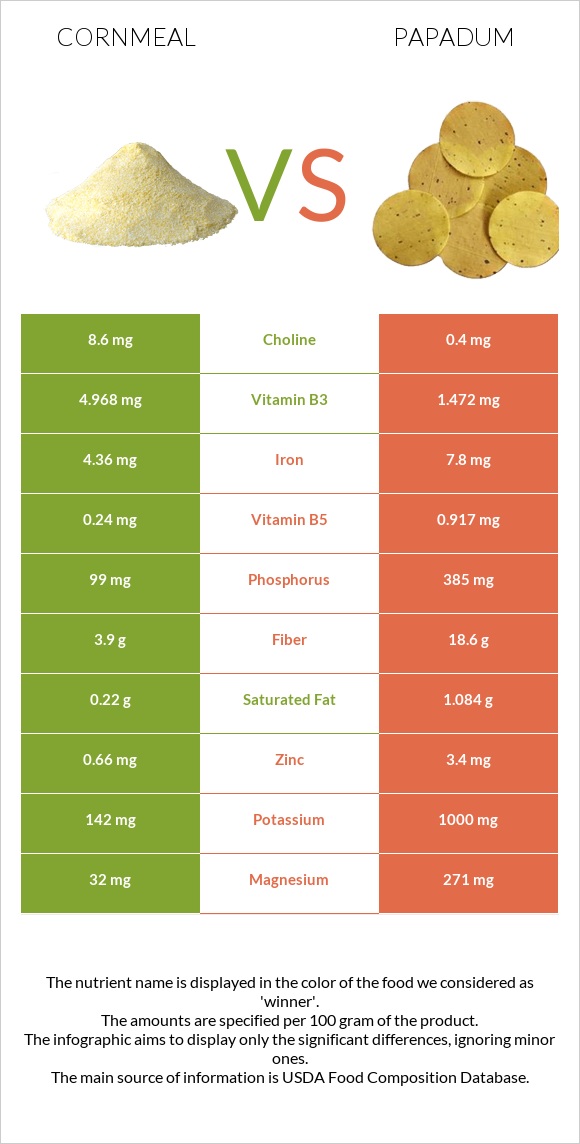
All nutrients comparison - raw data values
Nutrient
DV% diff.
Copper
0.076mg
0.998mg
102%
Sodium
7mg
1745mg
76%
Manganese
0.174mg
1.562mg
60%
Fiber
3.9g
18.6g
59%
Magnesium
32mg
271mg
57%
Iron
4.36mg
7.8mg
43%
Phosphorus
99mg
385mg
41%
Protein
7.11g
25.56g
37%
Starch
73.3g
30%
Potassium
142mg
1000mg
25%
Zinc
0.66mg
3.4mg
25%
Vitamin B1
0.551mg
0.277mg
23%
Vitamin B3
4.968mg
1.472mg
22%
Calcium
3mg
143mg
14%
Vitamin B5
0.24mg
0.917mg
14%
Vitamin B2
0.382mg
0.258mg
10%
Vitamin B6
0.182mg
0.285mg
8%
Carbs
79.45g
59.87g
7%
Selenium
10.5µg
8.3µg
4%
Saturated fat
0.22g
1.084g
4%
Folate
209µg
219µg
3%
Fats
1.75g
3.25g
2%
Polyunsaturated fat
0.828g
1.148g
2%
Cholesterol
0mg
4mg
1%
Choline
8.6mg
0.4mg
1%
Calories
370kcal
371kcal
0%
Protein per 100 calories
1.9g
6.9g
N/A
Calories per 10 g protein
520kcal
145kcal
N/A
Weight per 100 calories
27g
27g
N/A
Unsaturated / Saturated Fat ratio
5.5
1.5
N/A
Net carbs
75.55g
41.27g
N/A
Sugar
1.61g
0g
N/A
Vitamin A
11µg
13µg
0%
Vitamin E
0.12mg
0.05mg
0%
Vitamin K
0µg
0.4µg
0%
Monounsaturated fat
0.39g
0.532g
0%
Tryptophan
0.038mg
0.266mg
0%
Threonine
0.172mg
0.886mg
0%
Isoleucine
0.242mg
1.303mg
0%
Leucine
1.006mg
2.115mg
0%
Lysine
0.105mg
1.695mg
0%
Methionine
0.162mg
0.372mg
0%
Phenylalanine
0.366mg
1.491mg
0%
Valine
0.337mg
1.434mg
0%
Histidine
0.172mg
0.715mg
0%
Fructose
0.17g
0%
Macronutrient Comparison
Macronutrient breakdown side-by-side comparison
2
7%
2%
79%
11%
Protein:
7.11 g
Fats:
1.75 g
Carbs:
79.45 g
Water:
11.18 g
Other:
0.51 g
3
26%
3%
60%
3%
8%
Protein:
25.56 g
Fats:
3.25 g
Carbs:
59.87 g
Water:
3.49 g
Other:
7.83 g
Contains
more
Carbs Carbs
+32.7%
Contains
more
Water Water
+220.3%
Contains
more
Protein Protein
+259.5%
Contains
more
Fats Fats
+85.7%
Contains
more
Other Other
+1435.3%
Fat Type Comparison
Fat type breakdown side-by-side comparison
1
15%
27%
58%
Saturated fat:
Sat. Fat
0.22 g
Monounsaturated fat:
Mono. Fat
0.39 g
Polyunsaturated fat:
Poly. Fat
0.828 g
2
39%
19%
42%
Saturated fat:
Sat. Fat
1.084 g
Monounsaturated fat:
Mono. Fat
0.532 g
Polyunsaturated fat:
Poly. Fat
1.148 g
Contains
less
Sat. Fat Saturated fat
-79.7%
Contains
more
Mono. Fat Monounsaturated fat
+36.4%
Contains
more
Poly. Fat Polyunsaturated fat
+38.6%