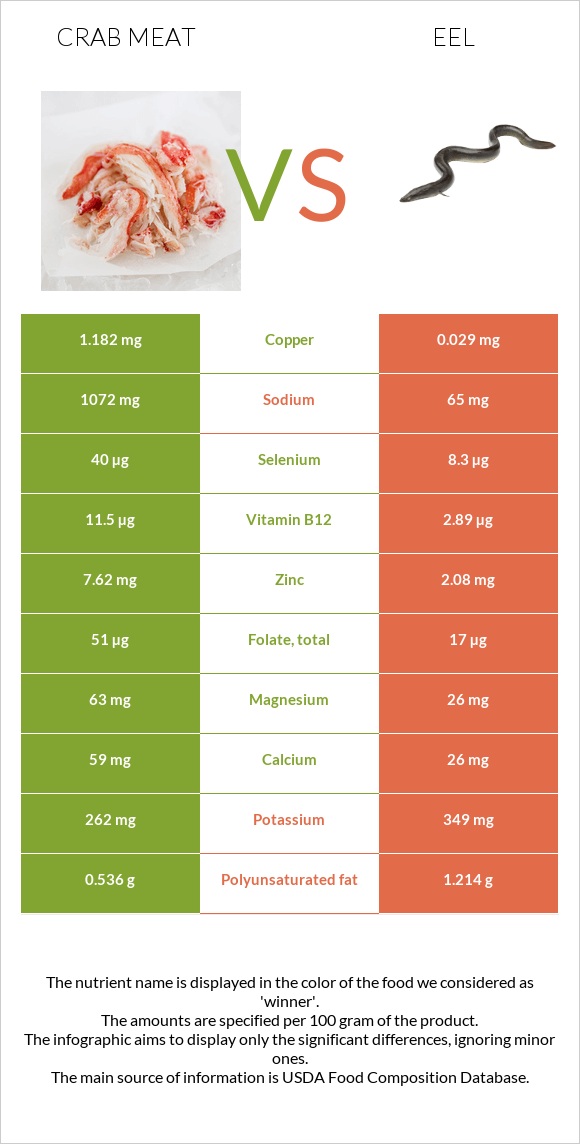
Summary of differences between crab meat and eels Crab meat has more vitamin B12, copper, selenium, and zinc; however, eels are higher in vitamin A, vitamin B3, and vitamin B1. Crab meat covers your daily need for vitamin B12, 359% more than eels. Crab meat has 41 times more copper than eels. While crab meat has 1.182mg of copper, eels have only 0.029mg. Eels have less sodium. These are the specific foods used in this comparison Crustaceans, crab, alaska king, cooked, moist heat and Fish, eel, mixed species, cooked, dry heat .
Infographic
Mineral Comparison
Mineral comparison score is based on the number of minerals by which one or the other food is richer. The "coverage" charts below show how much of the daily needs can be covered by 300 grams of the food.
6
100 g
300 g
3 oz - 85g 1 leg - 134g
Magnesium
Magnesium
Calcium
Calcium
Potassium
Potassium
Iron
Iron
Copper
Copper
Zinc
Zinc
Phosphorus
Phosphorus
Sodium
Sodium
Manganese
Manganese
Selenium
Selenium
45%
18%
23%
29%
394%
208%
120%
140%
5.2%
218%
2
100 g
300 g
1 cubic inch, boneless - 17g 1 oz with bone (yield after bone removed) - 22g 1 oz, boneless - 28.35g 3 oz - 85g 1 fillet - 159g
Magnesium
Magnesium
Calcium
Calcium
Potassium
Potassium
Iron
Iron
Copper
Copper
Zinc
Zinc
Phosphorus
Phosphorus
Sodium
Sodium
Manganese
Manganese
Selenium
Selenium
19%
7.8%
31%
24%
9.7%
57%
119%
8.5%
5.2%
45%
Vitamin Comparison
Vitamin comparison score is based on the number of vitamins by which one or the other food is richer. The "coverage" charts below show how much of the daily needs can be covered by 300 grams of the food.
5
100 g
300 g
3 oz - 85g 1 leg - 134g
Vitamin C
Vit. C
Vitamin D
Vit. D
Vitamin A
Vit. A
Vitamin E
Vit. E
Vitamin B1
Vit. B1
Vitamin B2
Vit. B2
Vitamin B3
Vit. B3
Vitamin B5
Vit. B5
Vitamin B6
Vit. B6
Vitamin B12
Vit. B12
Vitamin K
Vit. K
Folate
Folate
25%
0%
3%
0%
13%
13%
25%
24%
42%
1438%
0%
38%
3
100 g
300 g
1 cubic inch, boneless - 17g 1 oz with bone (yield after bone removed) - 22g 1 oz, boneless - 28.35g 3 oz - 85g 1 fillet - 159g
Vitamin C
Vit. C
Vitamin D
Vit. D
Vitamin A
Vit. A
Vitamin E
Vit. E
Vitamin B1
Vit. B1
Vitamin B2
Vit. B2
Vitamin B3
Vit. B3
Vitamin B5
Vit. B5
Vitamin B6
Vit. B6
Vitamin B12
Vit. B12
Vitamin K
Vit. K
Folate
Folate
6%
0%
379%
0%
46%
12%
84%
17%
18%
361%
0%
13%
All nutrients comparison - raw data values
Nutrient
DV% diff.
Vitamin B12
11.5µg
2.89µg
359%
Copper
1.182mg
0.029mg
128%
Vitamin A
9µg
1137µg
125%
Selenium
40µg
8.3µg
58%
Zinc
7.62mg
2.08mg
50%
Sodium
1072mg
65mg
44%
Cholesterol
53mg
161mg
36%
Monounsaturated fat
0.185g
9.218g
23%
Fats
1.54g
14.95g
21%
Vitamin B3
1.34mg
4.487mg
20%
Saturated fat
0.133g
3.023g
13%
Vitamin B1
0.053mg
0.183mg
11%
Protein
19.35g
23.65g
9%
Magnesium
63mg
26mg
9%
Folate
51µg
17µg
9%
Vitamin B6
0.18mg
0.077mg
8%
Calories
97kcal
236kcal
7%
Vitamin C
7.6mg
1.8mg
6%
Polyunsaturated fat
0.536g
1.214g
5%
Calcium
59mg
26mg
3%
Potassium
262mg
349mg
3%
Iron
0.76mg
0.64mg
2%
Vitamin B5
0.4mg
0.28mg
2%
Protein per 100 calories
20g
10g
N/A
Calories per 10 g protein
50kcal
100kcal
N/A
Weight per 100 calories
103g
42g
N/A
Unsaturated / Saturated Fat ratio
5.4
3.5
N/A
Phosphorus
280mg
277mg
0%
Manganese
0.04mg
0.04mg
0%
Vitamin B2
0.055mg
0.051mg
0%
Tryptophan
0.269mg
0.265mg
0%
Threonine
0.783mg
1.037mg
0%
Isoleucine
0.938mg
1.09mg
0%
Leucine
1.536mg
1.922mg
0%
Lysine
1.684mg
2.171mg
0%
Methionine
0.545mg
0.7mg
0%
Phenylalanine
0.817mg
0.923mg
0%
Valine
0.91mg
1.218mg
0%
Histidine
0.393mg
0.696mg
0%
Omega-3 - EPA
0.295g
0.108g
N/A
Omega-3 - DHA
0.118g
0.081g
N/A
Omega-3 - DPA
0.031g
0.095g
N/A
Macronutrient Comparison
Macronutrient breakdown side-by-side comparison
1
19%
78%
Protein:
19.35 g
Fats:
1.54 g
Carbs:
0 g
Water:
77.55 g
Other:
1.56 g
3
24%
15%
59%
2%
Protein:
23.65 g
Fats:
14.95 g
Carbs:
0 g
Water:
59.31 g
Other:
2.09 g
Contains
more
Water Water
+30.8%
Contains
more
Protein Protein
+22.2%
Contains
more
Fats Fats
+870.8%
Contains
more
Other Other
+34%
Fat Type Comparison
Fat type breakdown side-by-side comparison
1
16%
22%
63%
Saturated fat:
Sat. Fat
0.133 g
Monounsaturated fat:
Mono. Fat
0.185 g
Polyunsaturated fat:
Poly. Fat
0.536 g
2
22%
69%
9%
Saturated fat:
Sat. Fat
3.023 g
Monounsaturated fat:
Mono. Fat
9.218 g
Polyunsaturated fat:
Poly. Fat
1.214 g
Contains
less
Sat. Fat Saturated fat
-95.6%
Contains
more
Mono. Fat Monounsaturated fat
+4882.7%
Contains
more
Poly. Fat Polyunsaturated fat
+126.5%